Summary
Contents
Subject index
Quantitative Psychology is arguably one of the oldest disciplines within the field of psychology and nearly all psychologists are exposed to quantitative psychology in some form. While textbooks in statistics, research methods, and psychological measurement exist, none offer a unified treatment of quantitative psychology. The SAGE Handbook of Quantitative Methods in Psychology does just that. Each chapter covers a methodological topic with equal attention paid to established theory and the challenges facing methodologists as they address new research questions using that particular methodology. The reader will come away from each chapter with a greater understanding of the methodology being addressed as well as an understanding of the directions for future developments within that methodological area.
Drawing on a global scholarship the Handbook is divided into seven parts:
Part I: Measurement Theory: Begins with a chapter on classical test theory, followed by the common factor analysis model as a model for psychological measurement. The models for continuous latent variables in item response theory are covered next, followed by a chapter on discrete latent variable models as represented in latent class analysis.
Part II: Structural equation models: Addresses topics in general structural equation modeling, modeling mean structures, multiple-group models, nonlinear structural equation models, mixture models, and multilevel structural equation models.
Part III: Longitudinal models: Covers the analysis of longitudinal data via mixed modeling, repeated measures ANOVA, growth modeling, time series analysis, and event history analysis.
Part IV: Data analysis: Includes chapters on regression models, categorical data analysis, multilevel or hierarchical models, resampling methods, robust data analysis, meta-analysis, Bayesian data analysis, and cluster analysis.
Part V: Design and inference: Addresses issues in the inference of causal relations from experimental and non-experimental research, along with the design of true experiments and quasi-experiments, and the problem of missing data due to various influences such as attrition or non-compliance.
Part VI: Scaling methods: Covers metric and non-metric scaling methods as developed in multidimensional scaling, followed by consideration of the scaling of discrete measures as found in dual scaling and correspondence analysis. Models for preference data such as those found in random utility theory are covered next.
Part VII: Specialized methods: Covers specific topics including the analysis of social network data, the analysis of neuro-imaging data, and functional data analysis.
This volume is an excellent reference and resource for advanced students, academics, and professionals studying or using quantitative psychological methods in their research.
Functional Data Analysis
Functional Data Analysis
An Overview of Functional Data Analysis
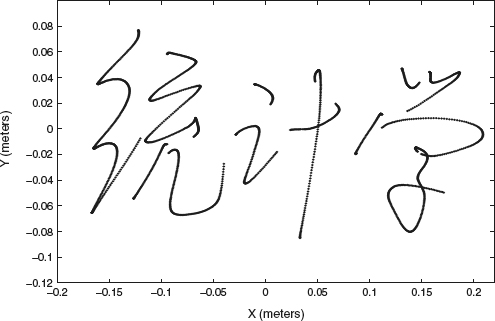
Functional data analysis explores samples of data where each observation arises from a curve or function. We require the data to provide enough information to estimate the curve and its properties that we wish to use. For example, Figure 30.1 displays one of 50 replications of the writing of ‘statistical science’ in Chinese described in Ramsay (2000). The curve is multivariate, being a trajectory in three-dimensional space: two coordinates X and Y on the writing surface plus the vertical coordinate Z. The location of the tip of the pen was recorded 400 times per second over the roughly six seconds required to write the script, with an error level of about 0.5 millimeters. This may sound like a lot of data, but there are 50 pen strokes, some of which have consistently sharp structures, and we have even more highly localized events, such as effects of friction as the pen makes or loses contact with the writing surface. We will find the structure in pen acceleration especially revealing, and estimating second and even third derivatives will be a challenge.
Functional data analysis assumes that the curve being estimated is smooth. Smoothness is closely connected with the concept of energy, and in fact most real world systems that we study in the social and life sciences as well as in chemistry and physics have a limited energy budget for producing change. Later in the chapter, we will see that an astonishing amount of energy is reflected in the second derivatives of the script coordinates, and that this energy is dispatched by the writer's motor cortex with a remarkable level of precision and stability. Even stock market prices, often considered to be intrinsically nonsmooth, reflect the supply of money available for securities transactions, and on a sufficiently fine time scale have limited capacities for change. In fact, without smoothness we would be lost, since a function is a potentially infinite dimensional object, being defined by its value x(t) at each value t on a continuum. Nothing infinite can be estimated accurately with a finite amount of data unless some principle like the conservation of energy guarantees that most of its variation will be low dimensional.
In practice, smoothness means that one or more of the curves's derivatives can be estimated, and it is the many ways in which we make use of derivative information that sets functional data analysis apart from neighboring methodologies in data analysis space. Good derivative estimates take us to an entirely new range of functional models, called dynamical systems, that model change directly by the use of differential equations. Although we admit that it may be some time before models like these appear in undergraduate texts in fields that do not require calculus of undergraduates, we claim that psychology and other social sciences abound in opportunities to model change.
Figure 30.1 One of 50 samples of the X and Y coordinates of pen position during the writing of ‘statistical science’ in Chinese. The script is composed of 50 strokes and takes about six seconds to produce. Gaps in the script correspond to the pen being lifted off the writing plane.
...
- Loading...
Get a 30 day FREE TRIAL
-
 Watch videos from a variety of sources bringing classroom topics to life
 -
Read modern, diverse business cases
-
Explore hundreds of books and reference titles

Read next

More like this
Sage Recommends
We found other relevant content for you on other Sage platforms.
Have you created a personal profile? Login or create a profile so that you can save clips, playlists and searches