
Entry
Reader's guide
Entries A-Z
Two-Way ANOVA
Two-way analysis of variance (two-way ANOVA) is the test used to analyze the DATA from a study in which the investigator wishes to examine both the separate and the combined effects of two VARIABLES on some measure of behavior. The data come from a factorial experiment or study in which separate levels of each of two variables or factors (e.g., Factor A and Factor B) are identified and all combinations are formed. Factors A and B may be manipulated INDEPENDENT VARIABLES, such as incentive level or performing alone versus in groups, or measured levels of subject variables, such as age and sex. Among the more interesting applications in the social sciences are ones in which Factor A is a manipulated independent variable and Factor B is a subject variable. The primary interest is then whether the effect of Factor A on the response measure differs for individuals defined by different levels of Factor B.
Consider, for example, a study of the effects of exposure to violent video games on subsequent aggressive behavior exhibited by young boys and girls. Let's say that the behavior being recorded—the DEPENDENT VARIABLE—is the number of times a child hits, kicks, or pushes another child during a 15-minute play session. Using a population of children of a certain age (say, 6 to 7 years old), children are randomly assigned to a condition where they play a 30-minute violent video game or a 30-minute nonviolent video game before the play session with other children. This constitutes the independent variable manipulation. This RANDOM ASSIGNMENT is done separately for boys and girls, resulting in a 2 × 2 design with two levels of type of video game crossed with two levels of gender.
| Table 1 Case of Significant Main Effects and No Significant Interaction | |||||
|---|---|---|---|---|---|
| Source | DF | SS | MS | F | p |
| Gender | 1 | 122.51 | 122.51 | 33.56 | <.0001 |
| Game | 1 | 103.51 | 103.51 | 28.35 | <.0001 |
| Gender × Game | 1 | 1.01 | 1.01 | 0.28 | .600 |
The resulting data and two-way ANOVA then can be used to address the following research questions: (a) Are boys more aggressive than girls? (b) Are children more aggressive following experience with a violent video game? and (c) Do boys and girls differ in the effect of exposure to violent video games? In ANOVA parlance, the first two questions are addressed by MAIN EFFECT tests—that is, averaged over experimental conditions, are the mean aggression scores significantly higher for boys than for girls, and, averaged over gender, are the mean aggression scores significantly higher in the Violent Video Game condition than in the Nonviolent Video Game condition? The third question, which is probably the one of greatest interest, is addressed by a test of INTERACTION—does the effect of exposure to violent video games differ significantly between boys and girls?
| Table 2 Case of Significant Main Effects and Significant Interaction | ||||||
|---|---|---|---|---|---|---|
| Source | DF | SS | MS | F | p | |
| Gender | 1 | 137.81 | 137.81 | 50.76 | <.0001 | |
| Game | 1 | 103.51 | 103.51 | 38.12 | <.0001 | |
| Gender × Game | 1 | 37.81 | 37.81 | 13.93 | <.0004 | |
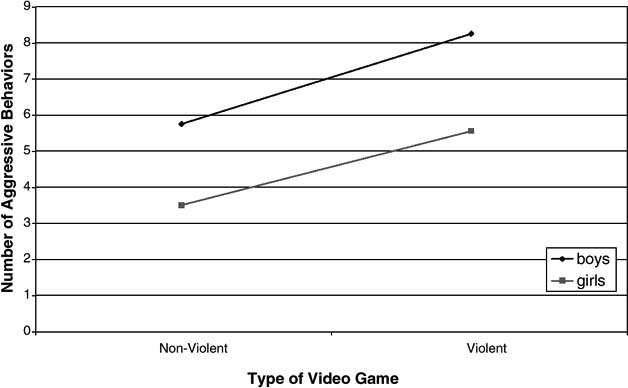
Figure 1 Aggressive Behavior as a Function of Gender and Video Game Type
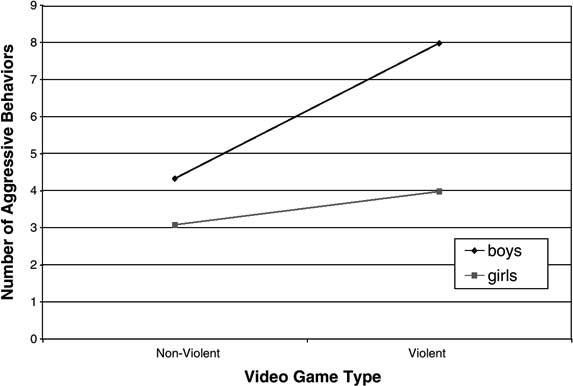
Figure 2 Aggressive Behavior as a Function of Gender and Video Game Type
...
- Analysis of Variance
- Association and Correlation
- Association
- Association Model
- Asymmetric Measures
- Biserial Correlation
- Canonical Correlation Analysis
- Correlation
- Correspondence Analysis
- Intraclass Correlation
- Multiple Correlation
- Part Correlation
- Partial Correlation
- Pearson's Correlation Coefficient
- Semipartial Correlation
- Simple Correlation (Regression)
- Spearman Correlation Coefficient
- Strength of Association
- Symmetric Measures
- Basic Qualitative Research
- Basic Statistics
- F Ratio
- N(n)
- t-Test
- X¯
- Y Variable
- z-Test
- Alternative Hypothesis
- Average
- Bar Graph
- Bell-Shaped Curve
- Bimodal
- Case
- Causal Modeling
- Cell
- Covariance
- Cumulative Frequency Polygon
- Data
- Dependent Variable
- Dispersion
- Exploratory Data Analysis
- Frequency Distribution
- Histogram
- Hypothesis
- Independent Variable
- Measures of Central Tendency
- Median
- Null Hypothesis
- Pie Chart
- Regression
- Standard Deviation
- Statistic
- Causal Modeling
- DISCOURSE/CONVERSATION ANALYSIS
- Econometrics
- Epistemology
- Ethnography
- Evaluation
- Event History Analysis
- Experimental Design
- Factor Analysis and Related Techniques
- Feminist Methodology
- Generalized Linear Models
- HISTORICAL/COMPARATIVE
- Interviewing in Qualitative Research
- Latent Variable Model
- LIFE HISTORY/BIOGRAPHY
- LOG-LINEAR MODELS (CATEGORICAL DEPENDENT VARIABLES)
- Longitudinal Analysis
- Mathematics and Formal Models
- Measurement Level
- Measurement Testing and Classification
- Multilevel Analysis
- Multiple Regression
- Qualitative Data Analysis
- Sampling in Qualitative Research
- Sampling in Surveys
- Scaling
- Significance Testing
- Simple Regression
- Survey Design
- Time Series
- ARIMA
- Box-Jenkins Modeling
- Cointegration
- Detrending
- Durbin-Watson Statistic
- Error Correction Models
- Forecasting
- Granger Causality
- Interrupted Time-Series Design
- Intervention Analysis
- Lag Structure
- Moving Average
- Periodicity
- Serial Correlation
- Spectral Analysis
- Time-Series Cross-Section (TSCS) Models
- Time-Series Data (Analysis/Design)
- Trend Analysis
Get a 30 day FREE TRIAL
-
 Watch videos from a variety of sources bringing classroom topics to life
 -
Read modern, diverse business cases
-
Explore hundreds of books and reference titles

Read next

More like this
Sage Recommends
We found other relevant content for you on other Sage platforms.
Have you created a personal profile? Login or create a profile so that you can save clips, playlists and searches