
Entry
Reader's guide
Entries A-Z
t-Test
It was William Gosset who, when performing quality controls at the Guinness brewery in Dublin, wrote articles in mathematical statistics under the pseudonym “Student.” His 1908 paper “The Probable Error of a Mean” provided the basis of Student's t-test. The use of his Student's t-distribution in many applications is an important contribution to the analysis of small samples in mathematical statistics.
STUDENT'S T-TEST OF A SINGLE MEAN
A simple example of such an application is the test of a mean. When σ is unknown and sample size is large, we can be confident that the estimated standard error of the mean ^σx¯ (standard deviation of the sampling distribution of means under H0) will be equal to the true σx¯, and the ratio we will evaluate and that will be referred to as a normal sampling distribution is the standardized score z = [X¯ − E(X¯)]/σx¯. However, when sample size is small, we cannot have this confidence in our estimate of the standard error; then, the ratio we use is not a z-score, but t = [X¯ − E(X¯)]/^σx¯, in which the denominator is not a constant but a random variable, which varies along with the sample size, that is, with the DEGREES OF FREEDOM.
The t-distribution has a mean of 0 and a symmetric and unimodal shape, but it is flatter in the middle and denser at the extremes in comparison with the NORMAL DISTRIBUTION. As sample size n grows large, the distribution of t approaches the standardized normal distribution.
Now, suppose we hypothesize that the mean income of a particular group, say, the chemists, is larger than 2,000 euros per month (Ha : μ > 2,000) as against the null hypothesis H0 :μ = 2,000. The standard deviation σ is unknown. We draw a small RANDOM SAMPLE of n = 26. We obtain X¯ = 2,040 and s = 100. Our estimate of ^σx¯ will be
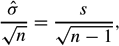
and consequently, the t-ratio is
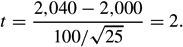
In the t-table, we find for a one-tailed test and α = 0.05 a critical t-value of t* = 1.706. Our sample value is higher, hence, the mean income of chemists is significantly higher than 2,000. Even in such a small sample, we obtain a significant result. However, had we performed a two-tailed test (t* = 2.056), then the result would have been nonsignificant.
STUDENT'S T-TEST OF DIFFERENCE OF MEANS
Another example of application of Student's t is the t-test of DIFFERENCE OF MEANS. We can think of two groups in an experimental design, such as a group of men and a group of women, for which the scores of a QUANTITATIVE VARIABLE are considered, let us say their smoking behavior measured as the number of cigarettes per day. In this example, the dependent variable Y (smoking) is CONTINUOUS, and the independent variable X (representing the two groups) is DICHOTOMOUS. We could give the experimental group and the control group the codes X = 1 and X = 2, respectively. We want to investigate whether the mean number of cigarettes for men (X = 1) is significantly different from (two-tailed test) or significantly lower than (one-tailed test) the mean number of cigarettes for women (X = 2). The null hypothesis states that the difference of means is equal to zero. Take two groups of five individuals, that is, n1 = n2 = 5. Let the series of scores for the total sample be2234456789 with mean 5 and variation 54. The group of men with scores 22344hasa mean of 3 and a variation of 4. The group of women with scores56789hasa mean of 7 and a variation of 10. The dispersions are unequal: variations 4 and 10. In order to perform a t-test legitimately, the distributions should be approximately normal (in the case of small groups), and the variances must not be significantly different. For both conditions, there exist a couple of test procedures, the test of normality and the test of homoskedasticity (LEVENE's TEST), respectively. Assuming that both conditions are fulfilled, the calculations are as follows.
...
- Analysis of Variance
- Association and Correlation
- Association
- Association Model
- Asymmetric Measures
- Biserial Correlation
- Canonical Correlation Analysis
- Correlation
- Correspondence Analysis
- Intraclass Correlation
- Multiple Correlation
- Part Correlation
- Partial Correlation
- Pearson's Correlation Coefficient
- Semipartial Correlation
- Simple Correlation (Regression)
- Spearman Correlation Coefficient
- Strength of Association
- Symmetric Measures
- Basic Qualitative Research
- Basic Statistics
- F Ratio
- N(n)
- t-Test
- X¯
- Y Variable
- z-Test
- Alternative Hypothesis
- Average
- Bar Graph
- Bell-Shaped Curve
- Bimodal
- Case
- Causal Modeling
- Cell
- Covariance
- Cumulative Frequency Polygon
- Data
- Dependent Variable
- Dispersion
- Exploratory Data Analysis
- Frequency Distribution
- Histogram
- Hypothesis
- Independent Variable
- Measures of Central Tendency
- Median
- Null Hypothesis
- Pie Chart
- Regression
- Standard Deviation
- Statistic
- Causal Modeling
- DISCOURSE/CONVERSATION ANALYSIS
- Econometrics
- Epistemology
- Ethnography
- Evaluation
- Event History Analysis
- Experimental Design
- Factor Analysis and Related Techniques
- Feminist Methodology
- Generalized Linear Models
- HISTORICAL/COMPARATIVE
- Interviewing in Qualitative Research
- Latent Variable Model
- LIFE HISTORY/BIOGRAPHY
- LOG-LINEAR MODELS (CATEGORICAL DEPENDENT VARIABLES)
- Longitudinal Analysis
- Mathematics and Formal Models
- Measurement Level
- Measurement Testing and Classification
- Multilevel Analysis
- Multiple Regression
- Qualitative Data Analysis
- Sampling in Qualitative Research
- Sampling in Surveys
- Scaling
- Significance Testing
- Simple Regression
- Survey Design
- Time Series
- ARIMA
- Box-Jenkins Modeling
- Cointegration
- Detrending
- Durbin-Watson Statistic
- Error Correction Models
- Forecasting
- Granger Causality
- Interrupted Time-Series Design
- Intervention Analysis
- Lag Structure
- Moving Average
- Periodicity
- Serial Correlation
- Spectral Analysis
- Time-Series Cross-Section (TSCS) Models
- Time-Series Data (Analysis/Design)
- Trend Analysis
Get a 30 day FREE TRIAL
-
 Watch videos from a variety of sources bringing classroom topics to life
 -
Read modern, diverse business cases
-
Explore hundreds of books and reference titles

Read next

More like this
Sage Recommends
We found other relevant content for you on other Sage platforms.
Have you created a personal profile? Login or create a profile so that you can save clips, playlists and searches