
Entry
Reader's guide
Entries A-Z
Standard Deviation
One of the primary properties of a set of numbers or scores is its variability or dispersion—how much the scores differ from one another. Probably the most commonly used measure of the variability of a set of scores is the standard deviation. It is popular both because it takes into account the exact numerical value of every score and because it is defined in the units of the scores themselves. That is, if heights are measured in inches, the standard deviation is also expressed in inches.
Most often, the standard deviation is considered as a supplement to measures of average, such as the arithmetic mean. For example, many cities have similar mean temperatures for the year, but they differ widely in variability of temperatures across seasons. In describing and comparing the weather in these cities, it would be informative to classify them in terms of variations in temperature across the year as well as overall yearly average temperature.
Similarly, in research designed to generate appropriate inferences about human behavior, standard deviations can be as important as means. Consider, for example, a program designed to increase students' test performance. To be sure, you'll be looking for an increase in average scores following the program. However, this increase could come in several forms. If the program helped each student to approximately the same degree, the mean scores would increase from before to after the program, but the standard deviations would be about the same. If, however, the program helped only the best students while leaving the rest unchanged, you would still get an increase in mean but also an increase in standard deviation (i.e., a greater separation of the best and worst students). For some educators, this latter result would not be considered as desirable as would be evident from inspection of means alone. The increased standard deviation would serve as an important clue as to how the program affected scores.
The standard deviation of a complete set or population of scores, σ, is defined as the square root of the sum of the squared differences between each score X and the mean of the scores, μ, divided by the number of scores N; that is,
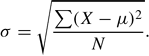
Squared differences are used because otherwise, the positive and negative differences would cancel each other. Without the square root, the measure σ2 is called the variance, but it is expressed in units squared (e.g., square inches) rather than the units themselves. In computing the standard deviation of a sample of scores, s, as an estimate of the population standard deviation, a slight correction is made in the formula:
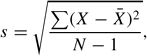
where X¯ is the mean of the sample of scores and N is replaced by N − 1. This corrects for an overall bias to underestimate the population standard deviation based on data from a sample. A “computational” form of the same equation is the following:
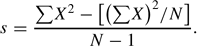
To illustrate, consider the following sample of 10
...
- Analysis of Variance
- Association and Correlation
- Association
- Association Model
- Asymmetric Measures
- Biserial Correlation
- Canonical Correlation Analysis
- Correlation
- Correspondence Analysis
- Intraclass Correlation
- Multiple Correlation
- Part Correlation
- Partial Correlation
- Pearson's Correlation Coefficient
- Semipartial Correlation
- Simple Correlation (Regression)
- Spearman Correlation Coefficient
- Strength of Association
- Symmetric Measures
- Basic Qualitative Research
- Basic Statistics
- F Ratio
- N(n)
- t-Test
- X¯
- Y Variable
- z-Test
- Alternative Hypothesis
- Average
- Bar Graph
- Bell-Shaped Curve
- Bimodal
- Case
- Causal Modeling
- Cell
- Covariance
- Cumulative Frequency Polygon
- Data
- Dependent Variable
- Dispersion
- Exploratory Data Analysis
- Frequency Distribution
- Histogram
- Hypothesis
- Independent Variable
- Measures of Central Tendency
- Median
- Null Hypothesis
- Pie Chart
- Regression
- Standard Deviation
- Statistic
- Causal Modeling
- DISCOURSE/CONVERSATION ANALYSIS
- Econometrics
- Epistemology
- Ethnography
- Evaluation
- Event History Analysis
- Experimental Design
- Factor Analysis and Related Techniques
- Feminist Methodology
- Generalized Linear Models
- HISTORICAL/COMPARATIVE
- Interviewing in Qualitative Research
- Latent Variable Model
- LIFE HISTORY/BIOGRAPHY
- LOG-LINEAR MODELS (CATEGORICAL DEPENDENT VARIABLES)
- Longitudinal Analysis
- Mathematics and Formal Models
- Measurement Level
- Measurement Testing and Classification
- Multilevel Analysis
- Multiple Regression
- Qualitative Data Analysis
- Sampling in Qualitative Research
- Sampling in Surveys
- Scaling
- Significance Testing
- Simple Regression
- Survey Design
- Time Series
- ARIMA
- Box-Jenkins Modeling
- Cointegration
- Detrending
- Durbin-Watson Statistic
- Error Correction Models
- Forecasting
- Granger Causality
- Interrupted Time-Series Design
- Intervention Analysis
- Lag Structure
- Moving Average
- Periodicity
- Serial Correlation
- Spectral Analysis
- Time-Series Cross-Section (TSCS) Models
- Time-Series Data (Analysis/Design)
- Trend Analysis
Get a 30 day FREE TRIAL
-
 Watch videos from a variety of sources bringing classroom topics to life
 -
Read modern, diverse business cases
-
Explore hundreds of books and reference titles

Read next

More like this
Sage Recommends
We found other relevant content for you on other Sage platforms.
Have you created a personal profile? Login or create a profile so that you can save clips, playlists and searches