
Entry
Reader's guide
Entries A-Z
Spearman Correlation Coefficient
A special case of the Pearson's correlation coefficient, the Spearman correlation coefficient (rs) is one of the most widely used nonparametric correlation coefficients and gauges the relationship between two variables measured at the ordinal level. Suppose creativity (denoted X) and productivity (denoted Y) of n subordinates are evaluated by a manager. The manager assigns one of the ranks (i.e., 1, 2,…, n) to all employees based on their creativity and productivity, respectively. Assuming there are no tied ranks on both variables, the relationship between creativity and productivity can be assessed by the Spearman correlation coefficient,
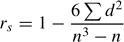
(where d is the difference between X and Y), which can actually be simplified from the formula for Pearson's correlation coefficient (Chen & Popovich, 2002).
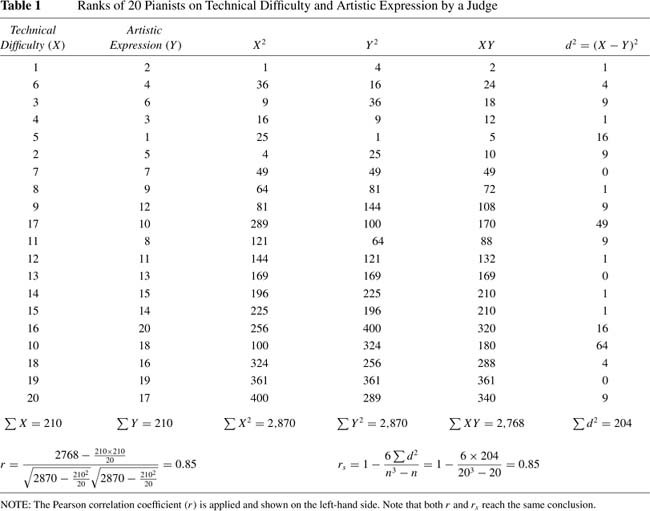
A careful examination of the simplified formula reveals that the greater the difference between two variables across n subjects, the greater the value of ∑d2 and the smaller the correlation coefficient. A fictitious example of 20 pianists' competition results is provided in Table 1. Each pianist is evaluated based on technical difficulty and artistic expression. Suppose a judge assigns ranks of 1 to 20 to each contestant on both performance categories, where rank 1 represents the highest performance. Assuming there are no tied ranks, the relationship between the two performance categories calculated by either the Spearman correlation coefficient or the Pearson correlation coefficient is 0.85. It should be emphasized that the above simplified formula cannot correctly calculate the Spearman correlation coefficient if tied ranks exist. The easiest way to calculate the Spearman correlation coefficient is to apply the Pearson correlation coefficient whenever either tied or nontied ranks exist.
| Table 2 Relationship Between Numbers of Annual Patent Applications and Quarterly Sales (in Millions) | ||||
|---|---|---|---|---|
| Organizations | Patent Application (X) | Quarterly Sales (Y) | Rank of X (RX) | Rank of Y (RY) |
| A | 20 | 5.60 | 5.0 | 6.5 |
| B | 9 | 1.10 | 2.0 | 1.0 |
| C | 50 | 6.60 | 9.0 | 9.0 |
| D | 33 | 7.20 | 8.0 | 10.0 |
| E | 17 | 4.30 | 3.0 | 4.0 |
| F | 25 | 5.60 | 6.0 | 6.5 |
| G | 79 | 6.30 | 10.0 | 8.0 |
| H | 5 | 2.90 | 1.0 | 2.0 |
| I | 27 | 4.90 | 7.0 | 5.0 |
| J | 19 | 3.70 | 4.0 | 3.0 |
| Correlation | Pearson correlation coefficient based on the untransformed data (X and Y) is 0.68. | Spearman correlation coefficient based on the transformed data (RX and RY) is 0.89. | ||
| NOTE: Organizations A and F are tied on quarterly sales. An average of rank 6 and rank 7, 6.5, is assigned to both organizations. | ||||
If the Spearman correlation coefficient is applied to variables measured on interval or ratio scales, ranks of the variables need to be artificially assigned first. Numbers of annual patent applications (X) and quarterly sales (Y) of 10 organizations are presented in Table 2. Both variables are measured as ratio scales. Prior to applying the Spearman correlation coefficient, values of both variables should be transformed into ranks, where rank 10 represents the highest performance. Following this transformation, the Spearman correlation coefficient can be obtained with the same procedure described earlier. Note that tied ranks exist for the quarterly sales variable (Organizations A and F). Hence, the
...
- Analysis of Variance
- Association and Correlation
- Association
- Association Model
- Asymmetric Measures
- Biserial Correlation
- Canonical Correlation Analysis
- Correlation
- Correspondence Analysis
- Intraclass Correlation
- Multiple Correlation
- Part Correlation
- Partial Correlation
- Pearson's Correlation Coefficient
- Semipartial Correlation
- Simple Correlation (Regression)
- Spearman Correlation Coefficient
- Strength of Association
- Symmetric Measures
- Basic Qualitative Research
- Basic Statistics
- F Ratio
- N(n)
- t-Test
- X¯
- Y Variable
- z-Test
- Alternative Hypothesis
- Average
- Bar Graph
- Bell-Shaped Curve
- Bimodal
- Case
- Causal Modeling
- Cell
- Covariance
- Cumulative Frequency Polygon
- Data
- Dependent Variable
- Dispersion
- Exploratory Data Analysis
- Frequency Distribution
- Histogram
- Hypothesis
- Independent Variable
- Measures of Central Tendency
- Median
- Null Hypothesis
- Pie Chart
- Regression
- Standard Deviation
- Statistic
- Causal Modeling
- DISCOURSE/CONVERSATION ANALYSIS
- Econometrics
- Epistemology
- Ethnography
- Evaluation
- Event History Analysis
- Experimental Design
- Factor Analysis and Related Techniques
- Feminist Methodology
- Generalized Linear Models
- HISTORICAL/COMPARATIVE
- Interviewing in Qualitative Research
- Latent Variable Model
- LIFE HISTORY/BIOGRAPHY
- LOG-LINEAR MODELS (CATEGORICAL DEPENDENT VARIABLES)
- Longitudinal Analysis
- Mathematics and Formal Models
- Measurement Level
- Measurement Testing and Classification
- Multilevel Analysis
- Multiple Regression
- Qualitative Data Analysis
- Sampling in Qualitative Research
- Sampling in Surveys
- Scaling
- Significance Testing
- Simple Regression
- Survey Design
- Time Series
- ARIMA
- Box-Jenkins Modeling
- Cointegration
- Detrending
- Durbin-Watson Statistic
- Error Correction Models
- Forecasting
- Granger Causality
- Interrupted Time-Series Design
- Intervention Analysis
- Lag Structure
- Moving Average
- Periodicity
- Serial Correlation
- Spectral Analysis
- Time-Series Cross-Section (TSCS) Models
- Time-Series Data (Analysis/Design)
- Trend Analysis
Get a 30 day FREE TRIAL
-
 Watch videos from a variety of sources bringing classroom topics to life
 -
Read modern, diverse business cases
-
Explore hundreds of books and reference titles

Read next

More like this
Sage Recommends
We found other relevant content for you on other Sage platforms.
Have you created a personal profile? Login or create a profile so that you can save clips, playlists and searches