
Entry
Reader's guide
Entries A-Z
Simple Correlation (Regression)
Simple correlation is a measure used to determine the strength and the direction of the relationship between two variables, X and Y. A simple correlation coefficient can range from –1 to 1. However, maximum (or minimum) values of some simple correlations cannot reach unity (i.e., 1 or –1). Given there are two sets of observations deviating from the correspondent means, x1, x2,…, xn and y1, y2,…, yn, a generalized simple correlation (rxy) can be defined as
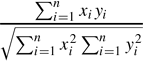
or

s2X and s2Y are variances of the variables X and Y, and cov(X, Y) is the covariance between the variables X and Y. Examples of this generalized simple correlation include Kendall's tau coefficient, Spearman correlation coefficient, and Pearson correlation coefficient.
A simple correlation between variables X and Y does not imply that either variable is an independent variable or a dependent variable. An observed relationship between job satisfaction and job performance reveals little as to whether satisfied employees are motivated to perform well, or those who perform well are proud of themselves, which, in turn, makes them feel more satisfied with their jobs. Further more, a simple correlation may or may not reflect the real association between two variables because the relationship can be influenced by one or more third variables. For instance, the observed relationship between school grade and intelligence for a group of elementary students could be influenced by students' socioeconomic status.
Assuming there is a linear relationship between the variables X and Y, we can use variable X to predict variable Y, or vice versa, with two regression equations, Y = a1 + by.xX + e1, and X = a2 + bx.yY + e2. Both by.x and bx.y are the regression coefficients, a1 and a2 are intercepts, and e1 and e2 are the residuals in variables X and Y that cannot be predicted by variable Y or variable X, respectively. Because  Conceptually, a simple correlation in this case is a geometric mean of two regression coefficients, by.x and bx.y. Furthermore, r2xy represents the proportion of variance accounted for by using either variable Y to predict variable X, or variable X to predict variable Y .
There are numerous simple correlations used to assess relationships with different characteristics. Some correlations are appropriate for assessing a monotonic relationship (e.g., Spearman correlation coefficient), a linear relationship (e.g., Pearson's correlation coefficient), or an asymmetric relationship (e.g., Somer's d). A positive or a negative monotonic relationship indicates that both variables are moving in the same direction or in opposite directions, respectively. A linear relationship, a special case of a monotonic relationship, implies that X can fairly predict variable Y (or vice versa) based on some linear function rules (e.g., Y = a + bX). An asymmetric relationship can occur when variable Y perfectly predicts variable X, but not vice versa.
The simple correlation can be generalized to more than two variables, such as the multiple correlation coefficient or the canonical correlation. Whereas the former assesses the relationship between a variable (i.e., criterion) and a set of other variables (i.e., predictors), the latter measures the relationship between two sets of variables. Furthermore, simple correlation can be used for variables measured at any of the levels of measurement. For example, we can assess the relationship between age (ratio scale) and gender (nominal scale), between Fahrenheit temperature (interval scale) and electricity consumption (ratio scale), or between letter grade (ordinal scale) and religion (nominal scale).
...
- Analysis of Variance
- Association and Correlation
- Association
- Association Model
- Asymmetric Measures
- Biserial Correlation
- Canonical Correlation Analysis
- Correlation
- Correspondence Analysis
- Intraclass Correlation
- Multiple Correlation
- Part Correlation
- Partial Correlation
- Pearson's Correlation Coefficient
- Semipartial Correlation
- Simple Correlation (Regression)
- Spearman Correlation Coefficient
- Strength of Association
- Symmetric Measures
- Basic Qualitative Research
- Basic Statistics
- F Ratio
- N(n)
- t-Test
- X¯
- Y Variable
- z-Test
- Alternative Hypothesis
- Average
- Bar Graph
- Bell-Shaped Curve
- Bimodal
- Case
- Causal Modeling
- Cell
- Covariance
- Cumulative Frequency Polygon
- Data
- Dependent Variable
- Dispersion
- Exploratory Data Analysis
- Frequency Distribution
- Histogram
- Hypothesis
- Independent Variable
- Measures of Central Tendency
- Median
- Null Hypothesis
- Pie Chart
- Regression
- Standard Deviation
- Statistic
- Causal Modeling
- DISCOURSE/CONVERSATION ANALYSIS
- Econometrics
- Epistemology
- Ethnography
- Evaluation
- Event History Analysis
- Experimental Design
- Factor Analysis and Related Techniques
- Feminist Methodology
- Generalized Linear Models
- HISTORICAL/COMPARATIVE
- Interviewing in Qualitative Research
- Latent Variable Model
- LIFE HISTORY/BIOGRAPHY
- LOG-LINEAR MODELS (CATEGORICAL DEPENDENT VARIABLES)
- Longitudinal Analysis
- Mathematics and Formal Models
- Measurement Level
- Measurement Testing and Classification
- Multilevel Analysis
- Multiple Regression
- Qualitative Data Analysis
- Sampling in Qualitative Research
- Sampling in Surveys
- Scaling
- Significance Testing
- Simple Regression
- Survey Design
- Time Series
- ARIMA
- Box-Jenkins Modeling
- Cointegration
- Detrending
- Durbin-Watson Statistic
- Error Correction Models
- Forecasting
- Granger Causality
- Interrupted Time-Series Design
- Intervention Analysis
- Lag Structure
- Moving Average
- Periodicity
- Serial Correlation
- Spectral Analysis
- Time-Series Cross-Section (TSCS) Models
- Time-Series Data (Analysis/Design)
- Trend Analysis
Get a 30 day FREE TRIAL
-
 Watch videos from a variety of sources bringing classroom topics to life
 -
Read modern, diverse business cases
-
Explore hundreds of books and reference titles

Read next

More like this
Sage Recommends
We found other relevant content for you on other Sage platforms.
Have you created a personal profile? Login or create a profile so that you can save clips, playlists and searches