
Entry
Reader's guide
Entries A-Z
Saturated Model
A saturated model has as many parameters as data values. The predicted or fitted values from a saturated model are equal to the data values; that is, a saturated model perfectly reproduces the data. A single observation or data point can be thought of as one piece of information; therefore, in a sample of n data points, there are n pieces of information. Each statistic or parameter computed from n data points uses up one piece of information. When a model has as many parameters as there is information in the data, the model is saturated, and the model is said to have zero degrees of freedom.
As a small example, suppose that we have a sample of three observations—x1 = 3, x2 = 5, and x3 = 10—from some population, and we want to fit the model xi = μ + βi to the data where μ and βi are parameters of the model. The βis may have a different value for each observation (i.e., i = 1, 2, and 3). A reasonable estimate of μ is the sample mean; that is, x¯ = (3 + 5 + 10)/3 = 6, which uses up one piece of information and leaves two pieces of information to estimate the βis. With the remaining two pieces of information, we can estimate two βis by taking the difference between a data value and the sample mean. For example, β^1 = (x1 − x¯) = (3 − 6) = −3, and β^2 = (x2 − x¯) = (5 − 6) = −1. We now have three estimated parameters, x¯, β^1, and β^2, which uses up all the information in the data. The value of the last parameter, β3, is computed using β^1 and β^2, along with the fact that the sum of differences between the data values and their mean equals zero; that is,
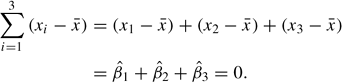
Solving this for β^3 gives us β^3 = −(β^1 − β^2) = −(−3 − 1) = 4. Using the estimated parameters in the model yields predicted values that are exactly equal to the data values; that is,
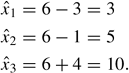
Models are fitted to data to provide a summary or description of data, to produce an equation for predicting future values, or to test hypotheses about the population from which the data were sampled. Generally, simpler models are preferred because they smooth out the unsystematic variation present in data, which results from having only a sample from a population. Although saturated models are extremely accurate, they do not distinguish between unsystematic and systematic variation in data.
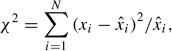
Saturated models play an important role in global goodness-of-fit statistical tests for nonsaturated models. All nonsaturated models are special cases of the saturated model. Consider two common statistics for testing model goodness-of-fit to data: Pearson's chi-square statistic,
and the likelihood ratio statistic,
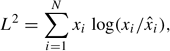
where xi equals an observed measurement on individual i, x^i equals the predicted or modeled measurement from an unsaturated model, and N equals the total number of observations. In both cases, the nonsaturated model's predicted values are compared to data values, which are the predicted values of the saturated model.
...
- Analysis of Variance
- Association and Correlation
- Association
- Association Model
- Asymmetric Measures
- Biserial Correlation
- Canonical Correlation Analysis
- Correlation
- Correspondence Analysis
- Intraclass Correlation
- Multiple Correlation
- Part Correlation
- Partial Correlation
- Pearson's Correlation Coefficient
- Semipartial Correlation
- Simple Correlation (Regression)
- Spearman Correlation Coefficient
- Strength of Association
- Symmetric Measures
- Basic Qualitative Research
- Basic Statistics
- F Ratio
- N(n)
- t-Test
- X¯
- Y Variable
- z-Test
- Alternative Hypothesis
- Average
- Bar Graph
- Bell-Shaped Curve
- Bimodal
- Case
- Causal Modeling
- Cell
- Covariance
- Cumulative Frequency Polygon
- Data
- Dependent Variable
- Dispersion
- Exploratory Data Analysis
- Frequency Distribution
- Histogram
- Hypothesis
- Independent Variable
- Measures of Central Tendency
- Median
- Null Hypothesis
- Pie Chart
- Regression
- Standard Deviation
- Statistic
- Causal Modeling
- DISCOURSE/CONVERSATION ANALYSIS
- Econometrics
- Epistemology
- Ethnography
- Evaluation
- Event History Analysis
- Experimental Design
- Factor Analysis and Related Techniques
- Feminist Methodology
- Generalized Linear Models
- HISTORICAL/COMPARATIVE
- Interviewing in Qualitative Research
- Latent Variable Model
- LIFE HISTORY/BIOGRAPHY
- LOG-LINEAR MODELS (CATEGORICAL DEPENDENT VARIABLES)
- Longitudinal Analysis
- Mathematics and Formal Models
- Measurement Level
- Measurement Testing and Classification
- Multilevel Analysis
- Multiple Regression
- Qualitative Data Analysis
- Sampling in Qualitative Research
- Sampling in Surveys
- Scaling
- Significance Testing
- Simple Regression
- Survey Design
- Time Series
- ARIMA
- Box-Jenkins Modeling
- Cointegration
- Detrending
- Durbin-Watson Statistic
- Error Correction Models
- Forecasting
- Granger Causality
- Interrupted Time-Series Design
- Intervention Analysis
- Lag Structure
- Moving Average
- Periodicity
- Serial Correlation
- Spectral Analysis
- Time-Series Cross-Section (TSCS) Models
- Time-Series Data (Analysis/Design)
- Trend Analysis
Get a 30 day FREE TRIAL
-
 Watch videos from a variety of sources bringing classroom topics to life
 -
Read modern, diverse business cases
-
Explore hundreds of books and reference titles

Read next

More like this
Sage Recommends
We found other relevant content for you on other Sage platforms.
Have you created a personal profile? Login or create a profile so that you can save clips, playlists and searches