
Entry
Reader's guide
Entries A-Z
Pearson's Correlation Coefficient
The Pearson's correlation coefficient (denoted as rxy) best represents the contemporary use of the simple correlation that assesses the linear relationship between two variables. The coefficient indicates the strength of the relationship, with values ranging from 0 to 1 in absolute value. The larger the magnitude of the coefficient, the stronger the relationship between the variables. The sign of the coefficient indicates the direction of the relationship as null, positive, or negative. A null relationship between variables X and Ysuggests that an increase in variable X is accompanied with both an increase and a decrease in variable Y and vice versa. A positive relationship indicates that an increase (or decrease) in variable X is associated with an increase (or decrease) in variable Y. In contrast, a negative relationship suggests that an increase (or decrease) in variable X is associated with a decrease (or increase) in variable Y .
Origin of Pearson's Correlation Coefficient
In the 19th century, Darwin's theory of evolution stimulated interest in making various measurements of living organisms. One of the best-known contributors of that time, Sir Francis Galton, offered the statistical concept of correlation in addition to the law of heredity. In his 1888 article (cited in Stigler, 1986), “Co-Relations and Their Measurement, Chiefly from Anthropometric Data,” Galton demonstrated that the regression lines for the lengths of the forearm and head had the same slope (denoted as r) when both variables used the same scale for the measurement. He labeled the r as an index of co-relation and characterized its identity as a regression coefficient. The spelling of co-relation was deliberately chosen to distinguish it from the word correlation, which was already being used in other disciplines, although the spelling was changed to correlation within a year. However, it was not until Karl Pearson (1857–1936) that Pearson's correlation coefficient was introduced.
Computational Formulas
The Pearson's correlation coefficient is also called the Pearson product-moment correlation, defined by

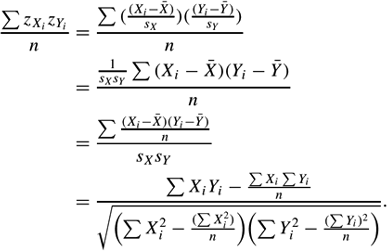
because it is obtained by multiplying the z-scores of two variables (i.e., the products), followed by taking the average (i.e., the moment) of these products. Various computational formulas for Pearson's correlation coefficient can be derived from the above formula (Chen & Popovich, 2002), as demonstrated as follows:
Interpretation of Pearson's Coefficient
Pearson's correlation coefficient does not suggest a cause-and-effect relationship between two variables. It cannot be interpreted as a proportion, nor does it represent the proportionate strength of a relationship. For example, a correlation of .40 is not twice as strong a relationship compared to a correlation of .20. In contrast to Pearson's correlation coefficient, r2xy (also labeled as the coefficient of determination) should be interpreted as a proportion. Say the Pearson's correlation coefficient for class grade and intelligence is .7. The r2xy value of .49 suggests that 49% of the variance is shared by intelligence and class grade. It can also be interpreted that 49% of the variance in intelligence is explained or predicted by class grade and vice versa.
Special Cases of Pearson's Correlation Coefficient
There are several well-known simple correlations such as the point-biserial correlation coefficient, thephi coefficient, the Spearman correlation coefficient, and the eta coefficient. All of them are special cases of Pearson's correlation coefficient. Suppose we use Pearson's correlation coefficient to assess the relationship between a dichotomous variable (e.g., gender) and a continuous variable (e.g., income). This correlation is often referred to as the point-biserial correlation coefficient. We can also use it to gauge the relationship between two dichotomous variables (e.g., gender and infection), and we refer to this coefficient as the Phi coefficient. If both variables are measured at the ordinal level and ranks of their characteristics are assigned, Pearson's correlation coefficient can also be applied to gauge the relationship. This coefficient is often labeled as the Spearman correlation coefficient. Finally, Pearson's correlation coefficient, when applied to measure the relationship between a multichotomous variable (e.g., races, schools, colors) and a continuous variable, is referred to as the Eta coefficient (Wherry, 1984).
...
- Analysis of Variance
- Association and Correlation
- Association
- Association Model
- Asymmetric Measures
- Biserial Correlation
- Canonical Correlation Analysis
- Correlation
- Correspondence Analysis
- Intraclass Correlation
- Multiple Correlation
- Part Correlation
- Partial Correlation
- Pearson's Correlation Coefficient
- Semipartial Correlation
- Simple Correlation (Regression)
- Spearman Correlation Coefficient
- Strength of Association
- Symmetric Measures
- Basic Qualitative Research
- Basic Statistics
- F Ratio
- N(n)
- t-Test
- X¯
- Y Variable
- z-Test
- Alternative Hypothesis
- Average
- Bar Graph
- Bell-Shaped Curve
- Bimodal
- Case
- Causal Modeling
- Cell
- Covariance
- Cumulative Frequency Polygon
- Data
- Dependent Variable
- Dispersion
- Exploratory Data Analysis
- Frequency Distribution
- Histogram
- Hypothesis
- Independent Variable
- Measures of Central Tendency
- Median
- Null Hypothesis
- Pie Chart
- Regression
- Standard Deviation
- Statistic
- Causal Modeling
- DISCOURSE/CONVERSATION ANALYSIS
- Econometrics
- Epistemology
- Ethnography
- Evaluation
- Event History Analysis
- Experimental Design
- Factor Analysis and Related Techniques
- Feminist Methodology
- Generalized Linear Models
- HISTORICAL/COMPARATIVE
- Interviewing in Qualitative Research
- Latent Variable Model
- LIFE HISTORY/BIOGRAPHY
- LOG-LINEAR MODELS (CATEGORICAL DEPENDENT VARIABLES)
- Longitudinal Analysis
- Mathematics and Formal Models
- Measurement Level
- Measurement Testing and Classification
- Multilevel Analysis
- Multiple Regression
- Qualitative Data Analysis
- Sampling in Qualitative Research
- Sampling in Surveys
- Scaling
- Significance Testing
- Simple Regression
- Survey Design
- Time Series
- ARIMA
- Box-Jenkins Modeling
- Cointegration
- Detrending
- Durbin-Watson Statistic
- Error Correction Models
- Forecasting
- Granger Causality
- Interrupted Time-Series Design
- Intervention Analysis
- Lag Structure
- Moving Average
- Periodicity
- Serial Correlation
- Spectral Analysis
- Time-Series Cross-Section (TSCS) Models
- Time-Series Data (Analysis/Design)
- Trend Analysis
Get a 30 day FREE TRIAL
-
 Watch videos from a variety of sources bringing classroom topics to life
 -
Read modern, diverse business cases
-
Explore hundreds of books and reference titles

Read next

More like this
Sage Recommends
We found other relevant content for you on other Sage platforms.
Have you created a personal profile? Login or create a profile so that you can save clips, playlists and searches