
Entry
Reader's guide
Entries A-Z
Path Analysis
Although the dictum “Correlation does not imply causation” is well rehearsed in research methods courses throughout the social sciences, its converse actually serves as the basis for path analysis and the larger structural equation modeling (SEM) family of quantitative data analysis methods (which also includes, for example, multiple regression analysis and confirmatory factor analysis). Specifically, under the right circumstances, “Causation does imply correlation.” That is to say, if one variable has a causal bearing on another, then a correlation (or covariance) should be observed in the data when all other relevant variables are controlled statistically and/or experimentally. Thus, path analysis may be described, in part, as the process of hypothesizing a model of causal (structural) relations among measured variables—as often represented in a path diagram—and then formally examining observed data relations for degree of fit with the initial hypotheses' expected relations.
Most modern treatments of path analysis trace the technique's beginnings to the work of the biometrician Sewell Wright (e.g., Wright, 1918), who first applied path analysis to correlations among bone measurements. The method was barely noticed in the social sciences until Otis Duncan (1966) and others introduced the technique in sociology. Spurred by methodological, computational, and applied developments mainly during the 1970s and 1980s by such scholars as K. G. Jöreskog, J. Ward Keesling, David Wiley, Dag Sörbom, Peter Bentler, and Bengt Muthén, countless applications have appeared throughout the social and behavioral sciences. For example, shifting focus from correlations to covariances allowed for the development of a formal statistical test of the fit between observed data and the hypothesized model. Furthermore, the possibility of including latent (i.e., unobserved) factors into path models and the development of more general estimation techniques (e.g., maximum likelihood, asymptotically distribution free) addressed major initial limitations of traditional correlational path analysis. Continuous refinements in specialized computer software throughout the 1980s, 1990s, and today (e.g., LISREL, EQS, AMOS, Mplus) have led to a simultaneous increase in technical sophistication and ease of use and thus have contributed to the proliferation of path analysis and more general SEM applications over the past three decades.
In this entry, typical steps in the path analysis process are introduced theoretically and via example. These steps include model conceptualization, parameter identification and estimation, effect decomposition, data-model fit assessment, and potential model modification and cross-validation. More detail about path analysis and SEM in general may be found in, for example, Bollen (1989), Kaplan (2000), Kline (1998), and Mueller (1996).
Foundational Principles
As an example, an education researcher might have a theory about the relations among four constructs: Mathematics Self-Concept (MSC), Reading Self-Concept (RSC), Task Goal Orientation (TGO), and Mathematics Proficiency (MP). The first three constructs are operationalized as scores from rating scale instruments, whereas the latter is operationalized as a standardized test score. Using the measured variables as proxies for their respective constructs, the theory may be expressed as shown in Figure 1. Each box represents a measured variable, labeled as V. A single-headed arrow represents a formal theoretical statement that the variable at the tail of the arrow might have a direct causal bearing on the variable at the head of the arrow (but not vice versa). As seen in the figure, RSC is hypothesized to affect TGO directly, MSC to affect TGO and MP, and TGO to affect MP. Variables that have no causal inputs within a model are said to be independent or exogenous variables (MSC and RSC), whereas those with causal inputs are dependentor endogenous variables (TGO and MP). Two other single-headed arrows appear in the figure, one into TGO and the other into MP. These signify all unrelated residual factors (“Errors,” labeled E) affecting each endogenous variable. Finally, a two-headed arrow indicates that the variables could be related but for reasons other than one causing the other (e.g., both influenced by some other variable(s) external to this model). MSC and RSC are hypothesized to have such a relation. Note that the two-headed arrow does not symbolize reciprocal causation (when variables are hypothesized to have a direct or indirect causal bearing on each other). Such would be an example of a larger class of nonrecursive models that is beyond the scope of this entry (see Berry, 1984; Kline, 1998).
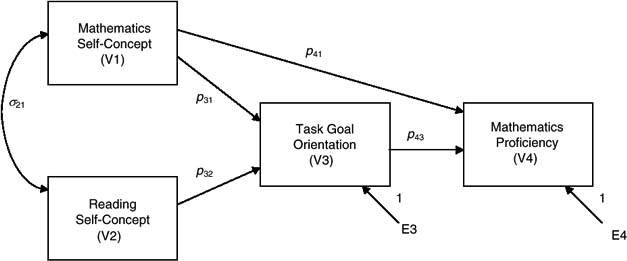
Figure 1 Hypothetical Path
...
- Analysis of Variance
- Association and Correlation
- Association
- Association Model
- Asymmetric Measures
- Biserial Correlation
- Canonical Correlation Analysis
- Correlation
- Correspondence Analysis
- Intraclass Correlation
- Multiple Correlation
- Part Correlation
- Partial Correlation
- Pearson's Correlation Coefficient
- Semipartial Correlation
- Simple Correlation (Regression)
- Spearman Correlation Coefficient
- Strength of Association
- Symmetric Measures
- Basic Qualitative Research
- Basic Statistics
- F Ratio
- N(n)
- t-Test
- X¯
- Y Variable
- z-Test
- Alternative Hypothesis
- Average
- Bar Graph
- Bell-Shaped Curve
- Bimodal
- Case
- Causal Modeling
- Cell
- Covariance
- Cumulative Frequency Polygon
- Data
- Dependent Variable
- Dispersion
- Exploratory Data Analysis
- Frequency Distribution
- Histogram
- Hypothesis
- Independent Variable
- Measures of Central Tendency
- Median
- Null Hypothesis
- Pie Chart
- Regression
- Standard Deviation
- Statistic
- Causal Modeling
- DISCOURSE/CONVERSATION ANALYSIS
- Econometrics
- Epistemology
- Ethnography
- Evaluation
- Event History Analysis
- Experimental Design
- Factor Analysis and Related Techniques
- Feminist Methodology
- Generalized Linear Models
- HISTORICAL/COMPARATIVE
- Interviewing in Qualitative Research
- Latent Variable Model
- LIFE HISTORY/BIOGRAPHY
- LOG-LINEAR MODELS (CATEGORICAL DEPENDENT VARIABLES)
- Longitudinal Analysis
- Mathematics and Formal Models
- Measurement Level
- Measurement Testing and Classification
- Multilevel Analysis
- Multiple Regression
- Qualitative Data Analysis
- Sampling in Qualitative Research
- Sampling in Surveys
- Scaling
- Significance Testing
- Simple Regression
- Survey Design
- Time Series
- ARIMA
- Box-Jenkins Modeling
- Cointegration
- Detrending
- Durbin-Watson Statistic
- Error Correction Models
- Forecasting
- Granger Causality
- Interrupted Time-Series Design
- Intervention Analysis
- Lag Structure
- Moving Average
- Periodicity
- Serial Correlation
- Spectral Analysis
- Time-Series Cross-Section (TSCS) Models
- Time-Series Data (Analysis/Design)
- Trend Analysis
Get a 30 day FREE TRIAL
-
 Watch videos from a variety of sources bringing classroom topics to life
 -
Read modern, diverse business cases
-
Explore hundreds of books and reference titles

Read next

More like this
Sage Recommends
We found other relevant content for you on other Sage platforms.
Have you created a personal profile? Login or create a profile so that you can save clips, playlists and searches