
Entry
Reader's guide
Entries A-Z
Moving Average
A moving average process is the product of a RANDOM shock, or disturbance, to a TIME SERIES. When the pattern of disturbances in the dependent variable can best be described by a weighted average of current and lagged random disturbances, then it is a moving average process. There are both immediate effects and discounted effects of the random shock over time, occurring over a fixed number of periods before disappearing. In a sense, a moving average is a linear combination of WHITE-NOISE error terms. The number of periods that it takes for the effects of the random shock on the dependent variable to disappear is termed the ORDER of the moving average process, denoted q. The length of the effects of the random shock is not dependent on the time at which the shock occurs, making a moving average process independent of time.
The mathematical representation of a moving average process with mean u = 0 and of order q is as follows:

Take, for instance, a moving average process of order q = 1: The effects of the random shock in period t would be evident in period t and period t –1, then in no period after. Although observations one time period apart are correlated, observations more than one time period apart are uncorrelated. The memory of the process is just one period. The order of the process can be said to be the memory of the process. An example would be the effect of a news report about the price of hog feed in Iowa. The effect of this random shock would be felt for the first day and then discounted for 1 or more days (order q). After several days, the effects of the shock would disappear, resulting in the series returning to its mean.
Identifying a moving average process requires examining the AUTOCORRELATION (ACF) and partial autocorrelation (PACF) functions. For a first-order moving average process, the ACF will have one spike and then abruptly cut off, with the remaining lags of the function exhibiting the properties of white noise; the PACF of a first-order moving average process will dampen infinitely. Figure 1 shows the ACF for a first-order moving average process. Moving average processes of order q will have an ACF that spikes significantly for lags 1 through q and then abruptly cuts off after lag q. In contrast, the PACF will dampen infinitely. Statistical packages such as SAS and SPSS will generate correlograms for quick assessment of ACFs and PACFs, although higher-order moving average processes are rare in the social sciences.
A moving average process can occur simultaneously with serial correlation and a TREND. Autoregressive, integrated, moving average (ARIMA) modeling is useful to model time series that exhibit a combination of these processes because it combines an autoregressive process, an integrated or differenced process (which removes a trend), and a moving average process. Furthermore, a moving average process can be written as an infinite-order autoregressive process. Conversely, an infinite-order autoregressive process can be written as a first-order moving average process. This is important because it allows for parsimonious expressions of complex processes as small orders of the other process.
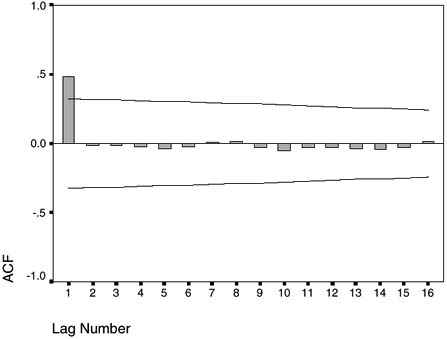
Figure 1 Theoretical Autocorrelation (ACF): MA(1)
...
- Analysis of Variance
- Association and Correlation
- Association
- Association Model
- Asymmetric Measures
- Biserial Correlation
- Canonical Correlation Analysis
- Correlation
- Correspondence Analysis
- Intraclass Correlation
- Multiple Correlation
- Part Correlation
- Partial Correlation
- Pearson's Correlation Coefficient
- Semipartial Correlation
- Simple Correlation (Regression)
- Spearman Correlation Coefficient
- Strength of Association
- Symmetric Measures
- Basic Qualitative Research
- Basic Statistics
- F Ratio
- N(n)
- t-Test
- X¯
- Y Variable
- z-Test
- Alternative Hypothesis
- Average
- Bar Graph
- Bell-Shaped Curve
- Bimodal
- Case
- Causal Modeling
- Cell
- Covariance
- Cumulative Frequency Polygon
- Data
- Dependent Variable
- Dispersion
- Exploratory Data Analysis
- Frequency Distribution
- Histogram
- Hypothesis
- Independent Variable
- Measures of Central Tendency
- Median
- Null Hypothesis
- Pie Chart
- Regression
- Standard Deviation
- Statistic
- Causal Modeling
- DISCOURSE/CONVERSATION ANALYSIS
- Econometrics
- Epistemology
- Ethnography
- Evaluation
- Event History Analysis
- Experimental Design
- Factor Analysis and Related Techniques
- Feminist Methodology
- Generalized Linear Models
- HISTORICAL/COMPARATIVE
- Interviewing in Qualitative Research
- Latent Variable Model
- LIFE HISTORY/BIOGRAPHY
- LOG-LINEAR MODELS (CATEGORICAL DEPENDENT VARIABLES)
- Longitudinal Analysis
- Mathematics and Formal Models
- Measurement Level
- Measurement Testing and Classification
- Multilevel Analysis
- Multiple Regression
- Qualitative Data Analysis
- Sampling in Qualitative Research
- Sampling in Surveys
- Scaling
- Significance Testing
- Simple Regression
- Survey Design
- Time Series
- ARIMA
- Box-Jenkins Modeling
- Cointegration
- Detrending
- Durbin-Watson Statistic
- Error Correction Models
- Forecasting
- Granger Causality
- Interrupted Time-Series Design
- Intervention Analysis
- Lag Structure
- Moving Average
- Periodicity
- Serial Correlation
- Spectral Analysis
- Time-Series Cross-Section (TSCS) Models
- Time-Series Data (Analysis/Design)
- Trend Analysis
Get a 30 day FREE TRIAL
-
 Watch videos from a variety of sources bringing classroom topics to life
 -
Read modern, diverse business cases
-
Explore hundreds of books and reference titles

Read next

More like this
Sage Recommends
We found other relevant content for you on other Sage platforms.
Have you created a personal profile? Login or create a profile so that you can save clips, playlists and searches