
Entry
Reader's guide
Entries A-Z
Intercept
The intercept is defined as the value of a variable, Y, when a line or curve cuts through the y-axis. In a two-dimensional graph, the intercept is therefore the value of Y when X is zero. The units of the intercept are the same as the units of Y.
There are problems with the interpretation of intercepts in REGRESSION contexts: The zero value of the X variable often lies outside of the range of X observations, so the value of Y when X is zero is therefore not of interest in practical or policy contexts.
However, the intercept is a critical component of regression equations.

or

The subscript j indicates the different variables, starting with a neutral constant term b0. The subscript i indicates the cases in the sample data set. The intercept a in the simple bivariate equation corresponds to the constant term b0 in the multivariate equation. The term b0 is a multiplicative constant applied to the first variable, X0, whose values are all set equal to 1. Thus, a variable X0 = 1 is created so that an intercept will be assigned to the whole equation.
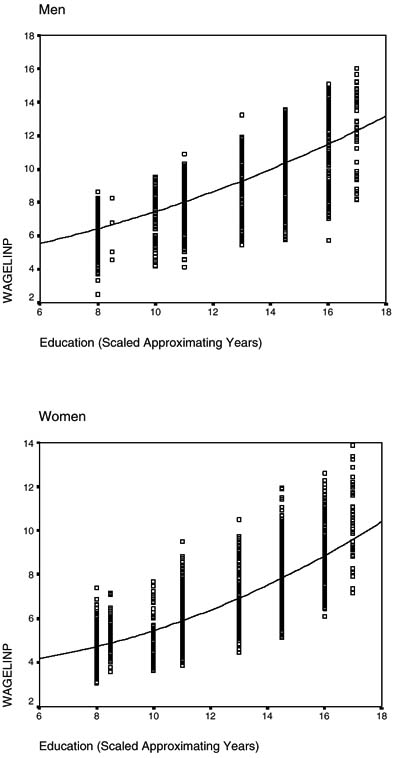
Figure 1 Hourly Wage Predicted by Regression: Education Dummy Variables
Diagrams can illustrate for both linear and nonlinear equations where the intercept will fall. Some curves have no intersection with the x-axis, and these have no intercept. However, for linear regression, there is always a y-intercept unless the slope is infinite. The y-intercept can be set to zero if desired before producing an estimate.
An example illustrates how the intercept can be of policy interest even while remaining outside the range of reasonable values for the independent variable. Regression equations for men's and women's wages per hour have been subjected to close scrutiny in view of the gender pay gap that exists in many countries (Monk-Turner & Turner, 2001). Other pay gaps, such as that between adominant and aminority ethnic group, also get close scrutiny. A wage equation that includes dummy values for the highest level of education shows the response of wages to education among men and women using U.K. 2000 data (Walby & Olsen, 2002). The log of wages is used to represent the skewed wage variable, and linear regression is then used. The predictions shown below are based upon a series of dummy variables for education producing a spline estimate. The predictions are then graphed against years of formal education. The curve shown is that which best fits the spline estimates.
In mathematical terms, the true intercept occurs when x = 0, as if 0 years of education were possible. However, the intercept visible in Figure 1 (£5.75 for men and £4.25 for women) forms part of the argument about gender wage gaps: The women's line has a lower intercept than the men's line. Much debate has occurred regarding the intercept difference (Madden, 2000).
In REGRESSION analysis, the constant term in these equations is a factor that depends upon all 32 independent variables in the equation (for details, see Taylor, 2000; Walby & Olsen, 2002). However, the regression constant B0 is not that which would be seen in this particular x − y graph. B0 is the constant in the multidimensional space of all the xis. However, a single graph showing one xi and the predicted values of y has a visible intercept on the xi-axis. Assumptions must be made regarding the implicit values of the other xis; they are usually held at their mean values, and these influence the intercept visible in the diagram of x −^y (i.e., the predictions of y along the domain of xi). Two-dimensional diagrams, with their visible intercepts and slopes, bear a complex relation to the mathematics of a complex MULTIPLE REGRESSION.
...
- Analysis of Variance
- Association and Correlation
- Association
- Association Model
- Asymmetric Measures
- Biserial Correlation
- Canonical Correlation Analysis
- Correlation
- Correspondence Analysis
- Intraclass Correlation
- Multiple Correlation
- Part Correlation
- Partial Correlation
- Pearson's Correlation Coefficient
- Semipartial Correlation
- Simple Correlation (Regression)
- Spearman Correlation Coefficient
- Strength of Association
- Symmetric Measures
- Basic Qualitative Research
- Basic Statistics
- F Ratio
- N(n)
- t-Test
- X¯
- Y Variable
- z-Test
- Alternative Hypothesis
- Average
- Bar Graph
- Bell-Shaped Curve
- Bimodal
- Case
- Causal Modeling
- Cell
- Covariance
- Cumulative Frequency Polygon
- Data
- Dependent Variable
- Dispersion
- Exploratory Data Analysis
- Frequency Distribution
- Histogram
- Hypothesis
- Independent Variable
- Measures of Central Tendency
- Median
- Null Hypothesis
- Pie Chart
- Regression
- Standard Deviation
- Statistic
- Causal Modeling
- DISCOURSE/CONVERSATION ANALYSIS
- Econometrics
- Epistemology
- Ethnography
- Evaluation
- Event History Analysis
- Experimental Design
- Factor Analysis and Related Techniques
- Feminist Methodology
- Generalized Linear Models
- HISTORICAL/COMPARATIVE
- Interviewing in Qualitative Research
- Latent Variable Model
- LIFE HISTORY/BIOGRAPHY
- LOG-LINEAR MODELS (CATEGORICAL DEPENDENT VARIABLES)
- Longitudinal Analysis
- Mathematics and Formal Models
- Measurement Level
- Measurement Testing and Classification
- Multilevel Analysis
- Multiple Regression
- Qualitative Data Analysis
- Sampling in Qualitative Research
- Sampling in Surveys
- Scaling
- Significance Testing
- Simple Regression
- Survey Design
- Time Series
- ARIMA
- Box-Jenkins Modeling
- Cointegration
- Detrending
- Durbin-Watson Statistic
- Error Correction Models
- Forecasting
- Granger Causality
- Interrupted Time-Series Design
- Intervention Analysis
- Lag Structure
- Moving Average
- Periodicity
- Serial Correlation
- Spectral Analysis
- Time-Series Cross-Section (TSCS) Models
- Time-Series Data (Analysis/Design)
- Trend Analysis
Get a 30 day FREE TRIAL
-
 Watch videos from a variety of sources bringing classroom topics to life
 -
Read modern, diverse business cases
-
Explore hundreds of books and reference titles

Read next

More like this
Sage Recommends
We found other relevant content for you on other Sage platforms.
Have you created a personal profile? Login or create a profile so that you can save clips, playlists and searches