
Entry
Reader's guide
Entries A-Z
Histogram
Histograms, BAR GRAPHS, and PIE CHARTS are used to display results in a simple, visual way. A bar chart would be used for categorical (nominal) variables, with each bar of the chart displaying the value of some variable. A histogram performs the same function for grouped data with an underlying CONTINUOUS VARIABLE (an ordinal, interval, or ratio distribution). The bars touch to reflect the continuous nature of the underlying distribution. A histogram or bar chart would be used in preference to a pie chart for showing trends across a variable (e.g., over time or by geographical locality). Pie charts are better for showing the percentage composition of a population.
Figure 1 shows the number of moves (changes of householder) recorded against properties where there has been a change of householder in the past year, in the center of a town in northeastern England that has been in decline since the collapse of its major industries but is now undergoing considerable regeneration. The figure shows nearly 150 properties that have had two changes of householder during the year and nontrivial numbers where ownership has been even more volatile. (The data for this figure are taken from Hobson-West & Sapsford, 2001.) As well as being descriptively useful, this kind of graph helps to determine the overall shape of the variable—the extent of departure from normality—which in this case is very substantial.
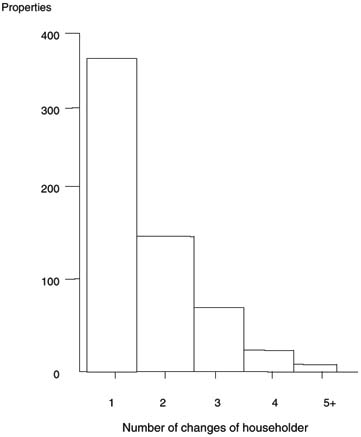
Figure 1 Number of Changes of Householder in Middlesbrough During 2001
Reference
- Analysis of Variance
- Association and Correlation
- Association
- Association Model
- Asymmetric Measures
- Biserial Correlation
- Canonical Correlation Analysis
- Correlation
- Correspondence Analysis
- Intraclass Correlation
- Multiple Correlation
- Part Correlation
- Partial Correlation
- Pearson's Correlation Coefficient
- Semipartial Correlation
- Simple Correlation (Regression)
- Spearman Correlation Coefficient
- Strength of Association
- Symmetric Measures
- Basic Qualitative Research
- Basic Statistics
- F Ratio
- N(n)
- t-Test
- X¯
- Y Variable
- z-Test
- Alternative Hypothesis
- Average
- Bar Graph
- Bell-Shaped Curve
- Bimodal
- Case
- Causal Modeling
- Cell
- Covariance
- Cumulative Frequency Polygon
- Data
- Dependent Variable
- Dispersion
- Exploratory Data Analysis
- Frequency Distribution
- Histogram
- Hypothesis
- Independent Variable
- Measures of Central Tendency
- Median
- Null Hypothesis
- Pie Chart
- Regression
- Standard Deviation
- Statistic
- Causal Modeling
- DISCOURSE/CONVERSATION ANALYSIS
- Econometrics
- Epistemology
- Ethnography
- Evaluation
- Event History Analysis
- Experimental Design
- Factor Analysis and Related Techniques
- Feminist Methodology
- Generalized Linear Models
- HISTORICAL/COMPARATIVE
- Interviewing in Qualitative Research
- Latent Variable Model
- LIFE HISTORY/BIOGRAPHY
- LOG-LINEAR MODELS (CATEGORICAL DEPENDENT VARIABLES)
- Longitudinal Analysis
- Mathematics and Formal Models
- Measurement Level
- Measurement Testing and Classification
- Multilevel Analysis
- Multiple Regression
- Qualitative Data Analysis
- Sampling in Qualitative Research
- Sampling in Surveys
- Scaling
- Significance Testing
- Simple Regression
- Survey Design
- Time Series
- ARIMA
- Box-Jenkins Modeling
- Cointegration
- Detrending
- Durbin-Watson Statistic
- Error Correction Models
- Forecasting
- Granger Causality
- Interrupted Time-Series Design
- Intervention Analysis
- Lag Structure
- Moving Average
- Periodicity
- Serial Correlation
- Spectral Analysis
- Time-Series Cross-Section (TSCS) Models
- Time-Series Data (Analysis/Design)
- Trend Analysis
Get a 30 day FREE TRIAL
-
 Watch videos from a variety of sources bringing classroom topics to life
 -
Read modern, diverse business cases
-
Explore hundreds of books and reference titles

Read next

More like this
Sage Recommends
We found other relevant content for you on other Sage platforms.
Have you created a personal profile? Login or create a profile so that you can save clips, playlists and searches