
Entry
Reader's guide
Entries A-Z
Detrending
Often, time-series data may exhibit an upward or downward trend over time. A trend may be present in the form of a change in the mean value and/or variance over time. A plot of a time series may be linear, demonstrating a trending mean over time. Regressing one such variable on another will often yield a high R-squared, yet the estimated parameters may not reflect the relationship between the two variables. Rather, the estimated parameters will be biased upwards because of the trend, resulting in a spurious relationship between the dependent and independent variables, reflecting the common trend present in both of them. When this is the case, observations may be detrended before fitting a model in order to obtain true estimates of the relationship between the dependent and independent variables. Figure 1 shows a series that is trending over time, and that same series after the trend has been removed.
A simple solution to this problem is to include a time, or trend, variable as an independent variable in a regression analysis. The trend variable need not be linear; if the series were to exhibit a cubic trend, then the trend variable could be X3, where X is time. Furthermore, some time series exhibit seasonal trends, and it is appropriate in these instances to include seasonal trend variables as well. Introducing a trend variable on the right-handside of the equation will yield for its coefficient an estimate of the true relationship between it and the dependent variable.
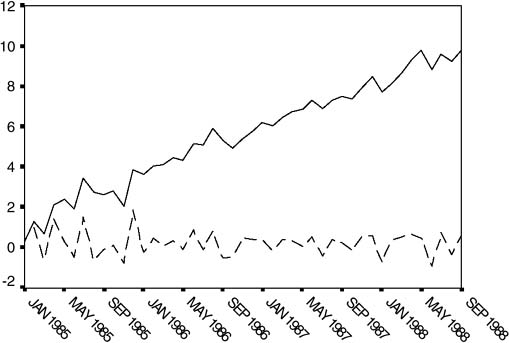
Figure 1 Example of a Trending Series and Same Series After Detrending
If the dependent and independent variables exhibit different trends, say, the dependent a linear trend and the independent a quadratic, then it may be useful to employ a more complex detrending process. First, regress the dependent variable on time to obtain the residuals, Û1t. Then, regress the independent variable on time to obtain the residuals, Û2t. Finally, regress Û1t on Û2t. With the time trend removed from both variables, the coefficient on Û2t will be the true relationship between the dependent and independent variable. This method for detrending is additionally useful if you wish to report not merely the relationship between the dependent variable and the independent variable, but their unique trends over time as well.
Detrending in this manner is only applicable for the series in question if the trend is deterministic. If the trend changes over time, it is said to be stochastic, and in this instance, arima modeling may be an appropriate method to use to discover the underlying relationship. A unit root test may be appropriate to determine whether the series is stationary. Trends are removed in ARIMA modeling by differencing series, or by subtracting previous values of the variable from the value at time t. Simple linear trends, such as those easily removed by including a trend variable inregression, may also be removed in ARIMA models with a first-differenced equation, or an equation where the dependent variable is change in y from time, t, to previous time, t − 1.
...
- Analysis of Variance
- Association and Correlation
- Association
- Association Model
- Asymmetric Measures
- Biserial Correlation
- Canonical Correlation Analysis
- Correlation
- Correspondence Analysis
- Intraclass Correlation
- Multiple Correlation
- Part Correlation
- Partial Correlation
- Pearson's Correlation Coefficient
- Semipartial Correlation
- Simple Correlation (Regression)
- Spearman Correlation Coefficient
- Strength of Association
- Symmetric Measures
- Basic Qualitative Research
- Basic Statistics
- F Ratio
- N(n)
- t-Test
- X¯
- Y Variable
- z-Test
- Alternative Hypothesis
- Average
- Bar Graph
- Bell-Shaped Curve
- Bimodal
- Case
- Causal Modeling
- Cell
- Covariance
- Cumulative Frequency Polygon
- Data
- Dependent Variable
- Dispersion
- Exploratory Data Analysis
- Frequency Distribution
- Histogram
- Hypothesis
- Independent Variable
- Measures of Central Tendency
- Median
- Null Hypothesis
- Pie Chart
- Regression
- Standard Deviation
- Statistic
- Causal Modeling
- DISCOURSE/CONVERSATION ANALYSIS
- Econometrics
- Epistemology
- Ethnography
- Evaluation
- Event History Analysis
- Experimental Design
- Factor Analysis and Related Techniques
- Feminist Methodology
- Generalized Linear Models
- HISTORICAL/COMPARATIVE
- Interviewing in Qualitative Research
- Latent Variable Model
- LIFE HISTORY/BIOGRAPHY
- LOG-LINEAR MODELS (CATEGORICAL DEPENDENT VARIABLES)
- Longitudinal Analysis
- Mathematics and Formal Models
- Measurement Level
- Measurement Testing and Classification
- Multilevel Analysis
- Multiple Regression
- Qualitative Data Analysis
- Sampling in Qualitative Research
- Sampling in Surveys
- Scaling
- Significance Testing
- Simple Regression
- Survey Design
- Time Series
- ARIMA
- Box-Jenkins Modeling
- Cointegration
- Detrending
- Durbin-Watson Statistic
- Error Correction Models
- Forecasting
- Granger Causality
- Interrupted Time-Series Design
- Intervention Analysis
- Lag Structure
- Moving Average
- Periodicity
- Serial Correlation
- Spectral Analysis
- Time-Series Cross-Section (TSCS) Models
- Time-Series Data (Analysis/Design)
- Trend Analysis
Get a 30 day FREE TRIAL
-
 Watch videos from a variety of sources bringing classroom topics to life
 -
Read modern, diverse business cases
-
Explore hundreds of books and reference titles

Read next

More like this
Sage Recommends
We found other relevant content for you on other Sage platforms.
Have you created a personal profile? Login or create a profile so that you can save clips, playlists and searches