
Entry
Reader's guide
Entries A-Z
Contextual Effects
The notion of groups plays a major role in social science. Does membership of an individual in a particular group have any impact on thoughts or actions of the individual? Does living in a neighborhood consisting of many Democrats mean than an individual has a higher probability of being a Democrat than otherwise would have been the case? Such an impact by the group is known as a contextual effect. The study of these effects is called contextual analysis or MULTILEVEL ANALYSIS. It is also known as the study of HIERARCHICAL models.
If contextual effects exist, it raises the following questions: Why does belonging to a group have an impact, how does this mechanism work, and how should we measure the impact? The first two questions may best be left to psychologists, but the third question has sparked much interest among statisticians and others. In particular, in education, a classroom makes an obvious group for contextual analyses.
When we have data on two variables on individuals from several groups, within each group we can analyze the relationship of a dependent variable Y and an independent variable X. Regression analysis gives a slope and an INTERCEPT for the regression line for each group. It may now be that the slopes and intercepts vary from one group to the next. If this variation in the regression lines is larger than can be explained by randomness alone, then there must be something about the groups themselves that affects the lines.
There can be several reasons why the slopes and intercepts vary. It may be that both depend on the level of the X variable in the group through the group mean. Thus, one possible contextual model can be expressed in the following equations:
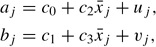
where a and b are the intercept and slope in the jth group, and the u and v are residual terms.
It is also possible to substitute for a and b in the equation for the line in the jth group. That gives the following equation:

for the ith individual in the jth group. Thus, we can now run a multiple regression on data from all the groups and get the c coefficients. For this model, c1 measures the effect of X on the level of the individual, c2 measures the effect of X on the level of the group, and c3 measures the effect on Y of the interaction of the individual and the group-level effects. One problem with this analysis is that the residual E depends on the group means of X; another is the COLLINEARITY that exists in the three explanatory variables.
Contextual analysis is not limited to the case in which the group intercepts and slopes depend on the group means of X. They could also depend on a variety of other variables.
Bayesian statistics lends itself particularly well to multilevel analysis because the slopes and intercepts vary from group to group. It may then be possible to specify how the intercepts and slopes within the groups come from specific distributions.
...
- Analysis of Variance
- Association and Correlation
- Association
- Association Model
- Asymmetric Measures
- Biserial Correlation
- Canonical Correlation Analysis
- Correlation
- Correspondence Analysis
- Intraclass Correlation
- Multiple Correlation
- Part Correlation
- Partial Correlation
- Pearson's Correlation Coefficient
- Semipartial Correlation
- Simple Correlation (Regression)
- Spearman Correlation Coefficient
- Strength of Association
- Symmetric Measures
- Basic Qualitative Research
- Basic Statistics
- F Ratio
- N(n)
- t-Test
- X¯
- Y Variable
- z-Test
- Alternative Hypothesis
- Average
- Bar Graph
- Bell-Shaped Curve
- Bimodal
- Case
- Causal Modeling
- Cell
- Covariance
- Cumulative Frequency Polygon
- Data
- Dependent Variable
- Dispersion
- Exploratory Data Analysis
- Frequency Distribution
- Histogram
- Hypothesis
- Independent Variable
- Measures of Central Tendency
- Median
- Null Hypothesis
- Pie Chart
- Regression
- Standard Deviation
- Statistic
- Causal Modeling
- DISCOURSE/CONVERSATION ANALYSIS
- Econometrics
- Epistemology
- Ethnography
- Evaluation
- Event History Analysis
- Experimental Design
- Factor Analysis and Related Techniques
- Feminist Methodology
- Generalized Linear Models
- HISTORICAL/COMPARATIVE
- Interviewing in Qualitative Research
- Latent Variable Model
- LIFE HISTORY/BIOGRAPHY
- LOG-LINEAR MODELS (CATEGORICAL DEPENDENT VARIABLES)
- Longitudinal Analysis
- Mathematics and Formal Models
- Measurement Level
- Measurement Testing and Classification
- Multilevel Analysis
- Multiple Regression
- Qualitative Data Analysis
- Sampling in Qualitative Research
- Sampling in Surveys
- Scaling
- Significance Testing
- Simple Regression
- Survey Design
- Time Series
- ARIMA
- Box-Jenkins Modeling
- Cointegration
- Detrending
- Durbin-Watson Statistic
- Error Correction Models
- Forecasting
- Granger Causality
- Interrupted Time-Series Design
- Intervention Analysis
- Lag Structure
- Moving Average
- Periodicity
- Serial Correlation
- Spectral Analysis
- Time-Series Cross-Section (TSCS) Models
- Time-Series Data (Analysis/Design)
- Trend Analysis
Get a 30 day FREE TRIAL
-
 Watch videos from a variety of sources bringing classroom topics to life
 -
Read modern, diverse business cases
-
Explore hundreds of books and reference titles

Read next

More like this
Sage Recommends
We found other relevant content for you on other Sage platforms.
Have you created a personal profile? Login or create a profile so that you can save clips, playlists and searches