
Entry
Reader's guide
Entries A-Z
Confidence Interval
A 100 (1 − α)% confidence interval is an interval estimate around a POPULATION parameter θ that, under repeated random samples of size N, would be expected to include θ's true value 100 (1 − α)% of the time. The confidence interval is a natural adjunct to PARAMETER ESTIMATION because it indicates the precision with which a POPULATION PARAMETER is estimated by a sample statistic.
The confidence level, 100 (1 − α)%, is chosen a priori. A TWO-SIDED confidence interval uses a lower limit L and upper limit U that each contain θ's true value 100 (1 − α/2)% of the time, so that together they contain θ's true value 100 (1 − α)% of the time. This interval often is written as [L,U], and sometimes writers combine a confidence level and interval by writing Pr(L<θ<U) = 1 − α. In some applications, a one sided confidence interval is used. Confidence intervals may be computed for a large variety of population parameters such as the MEAN, VARIANCE, proportion, and R-SQUARED.
The confidence interval is closely related to the SIGNIFICANCE TEST because a 100 (1 − α)% confidence interval includes all hypothetical values of the population parameter that cannot be rejected by a significance test using a significance criterion of α. In this respect, it provides more information than a significance test does. Confidence intervals become narrower with larger sample size and/or lower confidence levels.
The limits L and U are derived from a sample statistic (often the sample estimate of θ) and a sampling distribution that specifies the probability of getting each value that the sample statistic can take. Thus, L and U also are sample statistics and will vary from one sample to another. Suppose, for example, that a standard IQ test has been administered to a random sample of N = 15 adults from a large population with a sample mean of 104 and standard deviation (SD) of 18. We will construct a two-sided 95% confidence interval for the mean, μ. The limits U and L must have the property that, given a significance criterion of α, sample size of 15, mean of 104, and standard deviation of 18, we could reject the hypotheses that μ> 104 + U or μ< 104 − L but not L<μ<U. Figure 1 displays those limits.
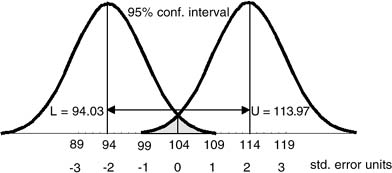
Figure 1 Lower and Upper Limits for the 95% Confidence Interval
The sampling distribution of the T ratio, where serr stands for the standard error of the mean, defined by

is a t-distribution with df = N − 1 = 14. When df = 14, the value tα/2 = 2.145 standard error units above the mean cuts α/2 = .025 from the upper tail of this t-distribution; likewise, −tα/2 =−2.145 standard error units below the mean cuts α/2 = .025 from the lower tail. The sample standard error is serr = SD/√N = 4.648. So a t-distribution around 104 + (2.145)(4.648) = 113.97 has .025 of its tail below 104, while a t-distribution around L = 104−(2.145)(4.648) = 94.03 has .025 of its tail above 104. These limits fulfill the above required property, so the 95% confidence interval for μ is [94.03, 113.97].
...
- Analysis of Variance
- Association and Correlation
- Association
- Association Model
- Asymmetric Measures
- Biserial Correlation
- Canonical Correlation Analysis
- Correlation
- Correspondence Analysis
- Intraclass Correlation
- Multiple Correlation
- Part Correlation
- Partial Correlation
- Pearson's Correlation Coefficient
- Semipartial Correlation
- Simple Correlation (Regression)
- Spearman Correlation Coefficient
- Strength of Association
- Symmetric Measures
- Basic Qualitative Research
- Basic Statistics
- F Ratio
- N(n)
- t-Test
- X¯
- Y Variable
- z-Test
- Alternative Hypothesis
- Average
- Bar Graph
- Bell-Shaped Curve
- Bimodal
- Case
- Causal Modeling
- Cell
- Covariance
- Cumulative Frequency Polygon
- Data
- Dependent Variable
- Dispersion
- Exploratory Data Analysis
- Frequency Distribution
- Histogram
- Hypothesis
- Independent Variable
- Measures of Central Tendency
- Median
- Null Hypothesis
- Pie Chart
- Regression
- Standard Deviation
- Statistic
- Causal Modeling
- DISCOURSE/CONVERSATION ANALYSIS
- Econometrics
- Epistemology
- Ethnography
- Evaluation
- Event History Analysis
- Experimental Design
- Factor Analysis and Related Techniques
- Feminist Methodology
- Generalized Linear Models
- HISTORICAL/COMPARATIVE
- Interviewing in Qualitative Research
- Latent Variable Model
- LIFE HISTORY/BIOGRAPHY
- LOG-LINEAR MODELS (CATEGORICAL DEPENDENT VARIABLES)
- Longitudinal Analysis
- Mathematics and Formal Models
- Measurement Level
- Measurement Testing and Classification
- Multilevel Analysis
- Multiple Regression
- Qualitative Data Analysis
- Sampling in Qualitative Research
- Sampling in Surveys
- Scaling
- Significance Testing
- Simple Regression
- Survey Design
- Time Series
- ARIMA
- Box-Jenkins Modeling
- Cointegration
- Detrending
- Durbin-Watson Statistic
- Error Correction Models
- Forecasting
- Granger Causality
- Interrupted Time-Series Design
- Intervention Analysis
- Lag Structure
- Moving Average
- Periodicity
- Serial Correlation
- Spectral Analysis
- Time-Series Cross-Section (TSCS) Models
- Time-Series Data (Analysis/Design)
- Trend Analysis
Get a 30 day FREE TRIAL
-
 Watch videos from a variety of sources bringing classroom topics to life
 -
Read modern, diverse business cases
-
Explore hundreds of books and reference titles

Read next

More like this
Sage Recommends
We found other relevant content for you on other Sage platforms.
Have you created a personal profile? Login or create a profile so that you can save clips, playlists and searches