Entry
Reader's guide
Entries A-Z
Biserial Correlation
Biserial correlation (rbis) is a correlational index that estimates the strength of a relationship between an artificially dichotomous variable (X) and a true continuous variable (Y). Both variables are assumed to be normally distributed in their underlying populations. It is used extensively in item analysis to correlate a dichotomously scored item with the total score. Assuming that an artificially dichotomous item is scored 1 for a correct answer and 0 for an incorrect answer, the biserial correlation is computed from
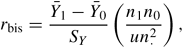
where Y¯1 is the mean of Y for those who scored 1 on X, Y¯0 is the mean of Y for those who scored 0 on X; SY is the standard deviation of all Y scores; n1 is the number of observations scored 1 on X; n0 is the number of observations scored 0 on X; n. = n1 + n0, or the total number of observations; and u is the ordinate (i.e., vertical height or the probability density) of the standard normal distribution at the cumulative probability of p1 = n1/n. (i.e., the proportion of observations scored 1 on X).
Assuming that the following data set is obtained from 30 examinees who took the Science Aptitude Test, their total test scores and item scores on Item #13 are as shown in the following table.
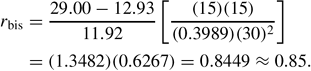
Treating the total score as the Y variable and the Item #13 score as the X variable, one calculates Y¯0 = 12.93, Y¯1 = 29, SY = 11.92, n0 = 15, n1 = 15, n. = 15 + 15 = 30, and p1 = 15/30 = 0.50. Taking p1 to the standard normal distribution, one determines the ordinate, u, to be 0.3989. Substituting these values into the formula above, one obtains the biserial correlation as follows:
The above value for biserial correlation can be interpreted as a measure of the degree to which the total score (continuous variable) differentiates between correct and incorrect answers on Item #13 (artificially dichotomous variable). The value of 0.85 suggests that the total score correlates strongly with the performance on this item. If the 15 students who failed this item had scored the lowest on the total test, the biserial correlation would have been 1.00 (the maximum). Conversely, if “pass” and “fail” on Item #13 were matched randomly with total scores, the biserial correlation would be 0.00 (the absolute minimum).
| Examinee | Item #13 score (X) | Total score (Y) | Examinee | Item #13 score (X) | Total score (Y) | Examinee | Item #13 score (X) | Total score (Y) |
| 1 | 0 | 8 | 11 | 1 | 14 | 21 | 0 | 28 |
| 2 | 0 | 12 | 12 | 1 | 13 | 22 | 1 | 33 |
| 3 | 0 | 6 | 13 | 0 | 10 | 23 | 1 | 32 |
| 4 | 0 | 12 | 14 | 0 | 9 | 24 | 1 | 32 |
| 5 | 0 | 8 | 15 | 0 | 8 | 25 | 1 | 33 |
| 6 | 0 | 8 | 16 | 1 | 33 | 26 | 0 | 34 |
| 7 | 0 | 8 | 17 | 0 | 28 | 27 | 1 | 35 |
| 8 | 0 | 11 | 18 | 1 | 29 | 28 | 1 | 34 |
| 9 | 1 | 13 | 19 | 1 | 30 | 29 | 1 | 38 |
| 10 | 0 | 4 | 20 | 1 | 29 | 30 | 1 | 37 |
The biserial correlation is an estimate of the product-moment correlation, namely, Pearson's r, if the normality assumption holds for X and Y population distributions. Its theoretical range is from −1to +1. In social sciences research, rbis computed from empirical data may be outside the theoretical range if the normality assumption is violated or when n· is smaller than 15. Thus, rbis may be interpreted as an estimate of Pearson's r only if (a) the normality assumption is not violated, (b) the sample size is large (at least 100), and (c) the value of p1 is not markedly different from 0.5. Biserial correlation should not be used in secondary analyses such as regression.
...
- Analysis of Variance
- Association and Correlation
- Association
- Association Model
- Asymmetric Measures
- Biserial Correlation
- Canonical Correlation Analysis
- Correlation
- Correspondence Analysis
- Intraclass Correlation
- Multiple Correlation
- Part Correlation
- Partial Correlation
- Pearson's Correlation Coefficient
- Semipartial Correlation
- Simple Correlation (Regression)
- Spearman Correlation Coefficient
- Strength of Association
- Symmetric Measures
- Basic Qualitative Research
- Basic Statistics
- F Ratio
- N(n)
- t-Test
- X¯
- Y Variable
- z-Test
- Alternative Hypothesis
- Average
- Bar Graph
- Bell-Shaped Curve
- Bimodal
- Case
- Causal Modeling
- Cell
- Covariance
- Cumulative Frequency Polygon
- Data
- Dependent Variable
- Dispersion
- Exploratory Data Analysis
- Frequency Distribution
- Histogram
- Hypothesis
- Independent Variable
- Measures of Central Tendency
- Median
- Null Hypothesis
- Pie Chart
- Regression
- Standard Deviation
- Statistic
- Causal Modeling
- DISCOURSE/CONVERSATION ANALYSIS
- Econometrics
- Epistemology
- Ethnography
- Evaluation
- Event History Analysis
- Experimental Design
- Factor Analysis and Related Techniques
- Feminist Methodology
- Generalized Linear Models
- HISTORICAL/COMPARATIVE
- Interviewing in Qualitative Research
- Latent Variable Model
- LIFE HISTORY/BIOGRAPHY
- LOG-LINEAR MODELS (CATEGORICAL DEPENDENT VARIABLES)
- Longitudinal Analysis
- Mathematics and Formal Models
- Measurement Level
- Measurement Testing and Classification
- Multilevel Analysis
- Multiple Regression
- Qualitative Data Analysis
- Sampling in Qualitative Research
- Sampling in Surveys
- Scaling
- Significance Testing
- Simple Regression
- Survey Design
- Time Series
- ARIMA
- Box-Jenkins Modeling
- Cointegration
- Detrending
- Durbin-Watson Statistic
- Error Correction Models
- Forecasting
- Granger Causality
- Interrupted Time-Series Design
- Intervention Analysis
- Lag Structure
- Moving Average
- Periodicity
- Serial Correlation
- Spectral Analysis
- Time-Series Cross-Section (TSCS) Models
- Time-Series Data (Analysis/Design)
- Trend Analysis
Get a 30 day FREE TRIAL
-
 Watch videos from a variety of sources bringing classroom topics to life
 -
Read modern, diverse business cases
-
Explore hundreds of books and reference titles

Read next

More like this
Sage Recommends
We found other relevant content for you on other Sage platforms.
Have you created a personal profile? Login or create a profile so that you can save clips, playlists and searches