
Entry
Reader's guide
Entries A-Z
Subject index
Pearson Product-Moment Correlation Coefficient
Among his many accomplishments, Sir Francis Galton first introduced the concept of correlation in a book titled Natural Inheritance, which was published in 1889. However, Karl Pearson is credited for extending the concept of correlation and for developing the product-moment correlation coefficient. Pearson's product-moment correlation coefficient is by far the most common index of the relationship between two variables, or bivariate relationship.
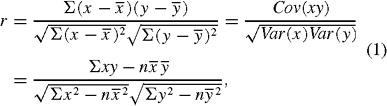
Pearson's product-moment correlation coefficient measures the degree to which the points in the scatterplot tend to cluster about a straight line. In other words, the product-moment correlation coefficient measures the degree of linear relationship between two variables. If we label the two variables of interest as x and y, then Pearson's product-moment correlation coefficient, denoted by r, is given by the following formula:
where

The first element of Equation 1 indicates that Pearson r is the ratio of the covariance between variables X and Y to the square root of the product of the x and y variances. Interestingly, only the numerators of the variance and covariance equation appear in the latter part of Equation 1 because the denominators cancel each other out. Furthermore, Equation 2 could be used to rewrite the Pearson r formula as

However, an even more interpretable way of expressing Pearson r is as follows:

where
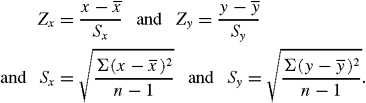
That is, Sx and Sy are the standard deviations of the two variables. Thus, Equation 4 indicates that Pearson r is the average cross-product of the standardized x and y variable scores. The fact that Pearson r can be expressed as a product of two variables measured in standard units means that we can express the relationship between two variables even if they are measured on different scales. For example, x can be measured in inches and y can be measured in acres, or in pounds, or in dollars. Provided that both variables are converted to standard units, r can measure their association.
If only the numerator in Equation 4 was used to compute Pearson r, then r would increase as the number of observations in the data set increased, regardless of the true relationship between the two variables. Therefore, n − 1 is needed in the denominator of Equation 4 to provide a statistic that is independent of the sample size. This denominator guarantees that r always lies between −1 and +1, inclusive.
Pearson's correlation coefficient helps to determine both the magnitude and direction of pairwise variable relationships. The sign of the coefficient tells us whether the relationship is positive or negative. A positive correlation means that as the values of one variable increases, so do the values of the second variable. Conversely, a negative relationship indicates that an increase in one variable is associated with a decrease in the other variable. The numerical part of the correlation coefficient indicates the magnitude of the relationship. A value of zero indicates no linear relationship between the two variables, whereas the closer the correlation coefficient is to 1 or –1, the greater the relationship between the variables.
...
- Biographies
- Babbage, Charles
- Bernoulli, Jakob
- Bonferroni, Carlo Emilio
- Bruno, James Edward
- Comrey, Andrew L.
- Cronbach, Lee J.
- Darwin, Charles
- Deming, William Edwards
- Fisher, Ronald Aylmer
- Galton, Sir Francis
- Gauss, Carl Friedrich
- Gresham, Frank M.
- Jackson, Douglas N.
- Malthus, Thomas
- Markov, Andrei Andreevich
- Pascal, Blaise
- Pearson, Karl
- Poisson, Siméon Denis
- Reynolds, Cecil R.
- Torrance, E. Paul
- Wilcoxon, Frank
- Charts, Graphs, and Visual Displays
- Computer Topics and Tools
- Concepts and Issues in Measurement
- Standards for Educational and Psychological Testing
- T Scores
- z Scores
- Ability Tests
- Achievement Tests
- Alternate Assessment
- Americans with Disabilities Act
- Anthropometry
- Aptitude Tests
- Artificial Neural Network
- Asymmetry of g
- Attitude Tests
- Basal Age
- Categorical Variable
- Classical Test Theory
- Coefficient Alpha
- Completion Items
- Computerized Adaptive Testing
- Construct Validity
- Content Validity
- Criterion Validity
- Criterion-Referenced Test
- Cronbach, Lee J.
- Curriculum-Based Measurement
- Diagnostic Validity
- Educational Testing Service
- Equivalence Testing
- Essay Items
- Ethical Issues in Testing
- Face Validity
- Gf-Gc Theory of Intelligence
- Guttman Scaling
- Health Insurance Portability and Accountability Act
- High-Stakes Tests
- Immediate and Delayed Memory Tasks
- Individuals with Disabilities Education Act
- Information Referenced Testing
- Informed Consent
- Intelligence Quotient
- Intelligence Tests
- Internal Review Board
- Interrater Reliability
- Interval Level of Measurement
- Ipsative Measure
- Item and Test Bias
- Item Response Theory
- KR-20 and KR-21
- Likert Scaling
- Measurement
- Measurement Error
- Metric Multidimensional Scaling
- Multiple-Choice Items
- Multitrait Multimethod Matrix and Construct Validity
- Nomothetic Versus Idiographic
- Ordinal Level of Measurement
- Parallel Forms Reliability
- Performance IQ
- Performance-Based Assessment
- Personality Tests
- Portfolio Assessment
- Predictive Validity
- Projective Testing
- Q Methodology
- Questionnaires
- Ratio Level of Measurement
- Reliability Theory
- Response to Intervention
- Reverse Scaling
- Scaling
- Section 504 of the Rehabilitation Act of 1973
- Self-Report
- Semantic Differential
- Semantic Differential Scale
- Six Sigma
- Spearman's Rho
- Split Half Reliability
- Standard Error of Measurement
- Standard Scores
- Test-Retest Reliability
- Thurstone Scaling
- Torrance, E. Paul
- True/False Items
- Validity Coefficient
- Validity Theory
- Verbal IQ
- Concepts and Issues in Statistics
- Artificial Neural Network
- Attenuation, Correction for
- Autocorrelation
- Bayesian Statistics
- Bioinformatics
- Central Limit Theorem
- Decision Theory
- Diggle-Kenward Model for Dropout
- DISTATIS
- Exploratory Factor Analysis
- Factorial Design
- Fourier Transform
- Generalized Additive Model
- Generalized Method of Moments
- Generalized Procrustes Analysis
- Graphical Statistical Methods
- Hierarchical Linear Modeling
- Historiometrics
- Logistic Regression Analysis
- Loglinear Analysis
- Markov Chain Monte Carlo Methods
- Matrix Operations
- Mean
- Measurement Error
- Mixtures of Experts
- Nonparametric Statistics
- Propensity Scores
- Rasch Measurement Model
- Regression Analysis
- Sampling Distribution of a Statistic
- Signal Detection Theory
- Simpson's Paradox
- Spurious Correlation
- Standard Error of the Mean
- Standard Scores
- Support Vector Machines
- Survival Analysis
- Type I Error
- Type II Error
- Data and Data Reduction Techniques
- Descriptive Statistics
- Arithmetic Mean
- Attenuation, Correction for
- Autocorrelation
- Average
- Average Deviation
- Bayley Scales of Infant Development
- Biserial Correlation Coefficient
- Class Interval
- Coefficients of Correlation, Alienation, and Determination
- Cognitive Psychometric Assessment
- Cohen's Kappa
- Correlation Coefficient
- Cumulative Frequency Distribution
- Deviation Score
- Difference Score
- Estimates of the Population Median
- Fisher's Z Transformation
- Frequency Distribution
- Galton, Sir Francis
- Grand Mean
- Harmonic Mean
- Histogram
- Kendall Rank Correlation
- Mean
- Measures of Central Tendency
- Median
- Mode
- Moving Average
- Parameter
- Parameter Invariance
- Part and Partial Correlations
- Pearson Product-Moment Correlation Coefficient
- Pearson, Karl
- Percentile and Percentile Rank
- Scattergram
- Semi-Interquartile Range
- Spurious Correlation
- Standard Deviation
- Survey Weights
- Text Analysis
- Evaluation
- Experimental Methods
- Standards for Educational and Psychological Testing
- Alternative Hypothesis
- American Statistical Association
- Americans with Disabilities Act
- Association for Psychological Science
- Basic Research
- Bioinformatics
- Complete Independence Hypothesis
- Continuous Variable
- Critical Value
- Data Collection
- Data Mining
- Delphi Technique
- Dependent Variable
- Descriptive Research
- Ethical Issues in Testing
- Ethical Principles in the Conduct of Research With Human Participants
- Fractional Randomized Block Design
- Hello-Goodbye Effect
- Hypothesis and Hypothesis Testing
- Independent Variable
- Informed Consent
- Instrumental Variables
- Internal Review Board
- Longitudinal/Repeated Measures Data
- Meta-Analysis
- Missing Data Method
- Mixed Models
- Mixture Models
- Moderator Variable
- Monte Carlo Methods
- Null Hypothesis Significance Testing
- Ockham's Razor
- Pairwise Comparisons
- Post Hoc Comparisons
- Projective Testing
- Quasi-Experimental Method
- Sample Size
- Section 504 of the Rehabilitation Act of 1973
- Significance Level
- Simple Main Effect
- Simulation Experiments
- Single-Subject Designs
- Statistical Significance
- Suppressor Variable
- Variable
- Variable Deletion
- Variance
- Inferential Statistics
- Akaike Information Criterion
- Analysis of Covariance (ANCOVA)
- Analysis of Variance (ANOVA)
- Bayes Factors
- Bayesian Information Criterion
- Binomial Test
- Bonferroni, Carlo Emilio
- Complete Independence Hypothesis
- Data Analysis ToolPak
- Exploratory Factor Analysis
- Factorial Design
- Fisher, Ronald Aylmer
- Hierarchical Linear Modeling
- Hypothesis and Hypothesis Testing
- Inferential Statistics
- Logistic Regression Analysis
- Markov, Andrei Andreevich
- Null Hypothesis Significance Testing
- Pairwise Comparisons
- Part and Partial Correlations
- Repeated Measures Analysis of Variance
- Type I Error
- Type II Error
- Wilcoxon, Frank
- Organizations and Publications
- Journal of Modern Applied Statistical Methods
- Journal of Statistics Education
- Journal of the American Statistical Association
- Abstracts
- American Doctoral Dissertations
- American Psychological Association
- American Statistical Association
- Association for Psychological Science
- Buros Institute of Mental Measurements
- Centers for Disease Control and Prevention
- Educational Testing Service
- National Science Foundation
- Psychometrics
- PsycINFO
- Society for Research in Child Development
- Prediction and Estimation
- Attributable Risk
- Bernoulli, Jakob
- Chance
- Conditional Probability
- Confidence Intervals
- Continuous Variable
- Curse of Dimensionality
- Decision Boundary
- Decision Theory
- File Drawer Problem
- Gambler's Fallacy
- Generalized Estimating Equations
- Law of Large Numbers
- Maximum Likelihood Method
- Nonprobability Sampling
- Pascal, Blaise
- Probability Sampling
- Random Numbers
- Relative Risk
- Signal Detection Theory
- Significance Level
- Three-Card Method
- Probability
- Qualitative Methods
- Samples, Sampling, and Distributions
- Acceptance Sampling
- Adaptive Sampling Design
- Age Norms
- Attrition Bias
- Career Maturity Inventory
- Central Limit Theorem
- Class Interval
- Cluster Sampling
- Confidence Intervals
- Convenience Sampling
- Cumulative Frequency Distribution
- Data Collection
- Diggle-Kenward Model for Dropout
- Gauss, Carl Friedrich
- Heteroscedasticity and Homoscedasticity
- Homogeneity of Variance
- Hypergeometric Distribution
- Kurtosis
- Malthus, Thomas
- Multicollinearity
- Multivariate Normal Distribution
- Nonprobability Sampling
- Normal Curve
- Ogive
- Parameter
- Percentile and Percentile Rank
- Poisson Distribution
- Poisson, Siméon Denis
- Posterior Distribution
- Prior Distribution
- Probability Sampling
- Quota Sampling
- Random Sampling
- Sample
- Sample Size
- Semi-Interquartile Range
- Simpson's Rule
- Skewness
- Smoothing
- Stanine
- Stratified Random Sampling
- Unbiased Estimator
- Statistical Techniques
- k-Means Cluster Analysis
- t Test for Two Population Means
- Binomial Distribution/Binomial and Sign Tests
- Bivariate Distributions
- Bonferroni Test
- Bowker Procedure
- Causal Analysis
- Centroid
- Chance
- Chi-Square Test for Goodness of Fit
- Chi-Square Test for Independence
- Classification and Regression Tree
- Cochran Q Test
- Cohen's Kappa
- Delta Method
- Dimension Reduction
- Discriminant Analysis
- Dissimilarity Coefficient
- Dixon Test for Outliers
- Dunn's Multiple Comparison Test
- Eigendecomposition
- Eigenvalues
- EM Algorithm
- Exploratory Data Analysis
- Factor Analysis
- Factor Scores
- Fisher Exact Probability Test
- Fisher's LSD
- Friedman Test
- Goodness-of-Fit Tests
- Grounded Theory
- Kolmogorov-Smirnov Test for One Sample
- Kolmogorov-Smirnov Test for Two Samples
- Kruskal-Wallis One-Way Analysis of Variance
- Latent Class Analysis
- Likelihood Ratio Test
- Lilliefors Test for Normality
- Mann-Whitney U Test (Wilcoxon Rank-Sum Test)
- McNemar Test for Significance of Changes
- Median Test
- Meta-Analysis
- Multiple Comparisons
- Multiple Factor Analysis
- Multiple Imputation for Missing Data
- Multivariate Analysis of Variance (MANOVA)
- Newman-Keuls Test
- O'Brien Test for Homogeneity of Variance
- Observational Studies
- One-Way Analysis of Variance
- Page's L Test
- Paired Samples t Test (Dependent Samples t Test)
- Path Analysis
- Peritz Procedure
- Scan Statistic
- Shapiro-Wilk Test for Normality
- Structural Equation Modeling
- Tests of Mediating Effects
- Three-Card Method
- Tukey-Kramer Procedure
- Wilcoxon Signed Ranks Test
- Statistical Tests
- t Test for Two Population Means
- Analysis of Covariance (ANCOVA)
- Analysis of Variance (ANOVA)
- Behrens-Fisher Test
- Binomial Distribution/Binomial and Sign Tests
- Binomial Test
- Bonferroni Test
- Bowker Procedure
- Chi-Square Test for Goodness of Fit
- Chi-Square Test for Independence
- Classification and Regression Tree
- Cochran Q Test
- Dixon Test for Outliers
- Dunn's Multiple Comparison Test
- Excel Spreadsheet Functions
- Fisher Exact Probability Test
- Fisher's LSD
- Friedman Test
- Goodness-of-Fit Tests
- Kolmogorov-Smirnov Test for One Sample
- Kolmogorov-Smirnov Test for Two Samples
- Kruskal-Wallis One-Way Analysis of Variance
- Latent Class Analysis
- Likelihood Ratio Test
- Lilliefors Test for Normality
- Mann-Whitney U Test (Wilcoxon Rank-Sum Test)
- McNemar Test for Significance of Changes
- Median Test
- Multiple Comparisons
- Multivariate Analysis of Variance (MANOVA)
- Newman-Keuls Test
- O'Brien Test for Homogeneity of Variance
- One- and Two-Tailed Tests
- One-Way Analysis of Variance
- Page's L Test
- Paired Samples t Test (Dependent Samples t Test)
- Peritz Procedure
- Repeated Measures Analysis of Variance
- Shapiro-Wilk Test for Normality
- Tests of Mediating Effects
- Tukey-Kramer Procedure
- Wilcoxon Signed Ranks Test
- Tests by Name
- Adjective Checklist
- Alcohol Use Inventory
- Armed Forces Qualification Test
- Armed Services Vocational Aptitude Battery
- Basic Personality Inventory
- Bayley Scales of Infant Development
- Beck Depression Inventory
- Behavior Assessment System for Children
- Bender Visual Motor Gestalt Test
- Bracken Basic Concept Scale–Revised
- California Psychological Inventory
- Career Assessment Inventory
- Career Development Inventory
- Career Maturity Inventory
- Carroll Depression Scale
- Children's Academic Intrinsic Motivation Inventory
- Clinical Assessment of Attention Deficit
- Clinical Assessment of Behavior
- Clinical Assessment of Depression
- Cognitive Abilities Test
- Cognitive Psychometric Assessment
- Comrey Personality Scales
- Coping Resources Inventory for Stress
- Culture Fair Intelligence Test
- Differential Aptitude Test
- Ecological Momentary Assessment
- Edwards Personal Preference Schedule
- Embedded Figures Test
- Fagan Test of Infant Intelligence
- Family Environment Scale
- Gerontological Apperception Test
- Goodenough Harris Drawing Test
- Graduate Record Examinations
- Holden Psychological Screening Inventory
- Illinois Test of Psycholinguistic Abilities
- Information Systems Interaction Readiness
- Internal External Locus of Control Scale
- International Assessment of Educational Progress
- Iowa Tests of Basic Skills
- Iowa Tests of Educational Development
- Jackson Personality Inventory–Revised
- Jackson Vocational Interest Survey
- Kaufman Assessment Battery for Children
- Kinetic Family Drawing Test
- Kingston Standardized Cognitive Assessment
- Kuder Occupational Interest Survey
- Laboratory Behavioral Measures of Impulsivity
- Law School Admissions Test
- Life Values Inventory
- Luria Nebraska Neuropsychological Battery
- Male Role Norms Inventory
- Matrix Analogies Test
- Millon Behavioral Medicine Diagnostic
- Millon Clinical Multiaxial Inventory-III
- Minnesota Clerical Test
- Minnesota Multiphasic Personality Inventory
- Multidimensional Aptitude Battery
- Multiple Affect Adjective Checklist–Revised
- Myers-Briggs Type Indicator
- NEO Personality Inventory
- Neonatal Behavioral Assessment Scale
- Peabody Picture Vocabulary Test
- Personal Projects Analysis
- Personality Assessment Inventory
- Personality Research Form
- Piers-Harris Children's Self-Concept Scale
- Preschool Language Assessment Instrument
- Profile Analysis
- Projective Hand Test
- Quality of Well-Being Scale
- Raven's Progressive Matrices
- Roberts Apperception Test for Children
- Rorschach Inkblot Test
- Sixteen Personality Factor Questionnaire
- Social Climate Scales
- Social Skills Rating System
- Spatial Learning Ability Test
- Stanford Achievement Test
- Stanford-Binet Intelligence Scales
- Strong Interest Inventory
- Stroop Color and Word Test
- Structured Clinical Interview for DSM-IV
- System of Multicultural Pluralistic Assessment
- Thematic Apperception Test
- Torrance Tests of Creative Thinking
- Torrance Thinking Creatively in Action and Movement
- Universal Nonverbal Intelligence Test
- Vineland Adaptive Behavior Scales
- Vineland Social Maturity Scale
- Wechsler Adult Intelligence Scale
- Wechsler Individual Achievement Test
- Wechsler Preschool and Primary Scale of Intelligence
- West Haven-Yale Multidimensional Pain Inventory
- Woodcock Johnson Psychoeducational Battery
- Woodcock Reading Mastery Tests Revised
- Loading...
Get a 30 day FREE TRIAL
-
 Watch videos from a variety of sources bringing classroom topics to life
 -
Read modern, diverse business cases
-
Explore hundreds of books and reference titles

Read next

More like this
Sage Recommends
We found other relevant content for you on other Sage platforms.
Have you created a personal profile? Login or create a profile so that you can save clips, playlists and searches