
Entry
Entries A-Z
Fisher's z transformation
the logarithmic transformation of Pearson's correlation coefficient. Its common use is in the z test which compares the size of two correlation coefficients from two unrelated samples. (This is obviously different from the more conventional test of whether a single correlation coefficient differs from zero.) Without the transformation, the distribution of differences between the two correlation coefficients becomes very skewed and unmanageable.
Table F.5 r to z transformation
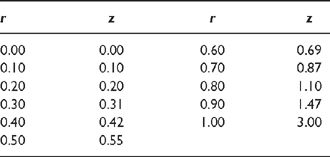
This transformation may be found by looking up the appropriate value in a table or by computing it directly using the following formula where loge stands for the natural logarithm and r for Pearson's correlation:

The values of Pearson's correlation vary from 0 to ± 1 as shown in Table F.5 and the values of the z correlation from 0 to about ±3 (though, effectively, infinity).
Get a 30 day FREE TRIAL
-
 Watch videos from a variety of sources bringing classroom topics to life
 -
Read modern, diverse business cases
-
Explore hundreds of books and reference titles

Read next

More like this
Sage Recommends
We found other relevant content for you on other Sage platforms.
Have you created a personal profile? Login or create a profile so that you can save clips, playlists and searches