
Entry
Entries A-Z
alpha (a) reliability, Cronbach's
one of a number of measures of the internal consistency of items on questionnaires, tests and other instruments. It is used when all the items on the measure (or some of the items) are intended to measure the same concept (such as personality traits such as neuroticism). When a measure is internally consistent, all of the individual questions or items making up that measure should correlate well with the others. One traditional way of checking this is split-half reliability in which the items making up the measure are split into two sets (odd-numbered items versus even-numbered items, the first half of the items compared with the second half). The two separate sets are then summated to give two separate measures of what would appear to be the same concept. For example, the following four items serve to illustrate a short scale intended to measure liking for different foodstuffs:
Table A.2 Preferences for four foodstuffs plus a total for number of preferences
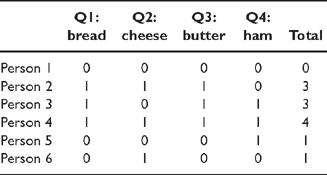
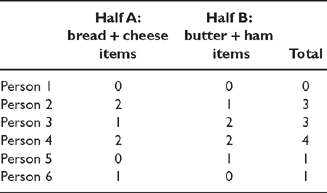
Table A.3 The data from Table A.2 with
Q1 and Q2 added, and Q3 and Q4 added
| 1 I like bread | Agree Disagree |
| 2 I like cheese | Agree Disagree |
| 3 I like butter | Agree Disagree |
| 4 I like ham | Agree Disagree |
Responses to these four items are given in Table A.2 for six individuals. One split half of the test might be made up of items 1 and 2, and the other split half is made up of items 3 and 4. These sums are given in Table A.3. If the items measure the same thing, then the two split halves should correlate fairly well together. This turns out to be the case since the correlation of the two split halves with each other is 0.5 (although it is not significant with such a small sample size). Another name for this correlation is the split-half reliability.
Since there are many ways of splitting the items on a measure, there are numerous split halves for most measuring instruments. One could calculate the odd-even reliability for the same data by summing items 1 and 3 and summing items 2 and 4. These two forms of reliability can give different values. This is inevitable as they are based on different combinations of items.
Conceptually alpha is simply the average of all of the possible split-half reliabilities that could be calculated for any set of data. With a measure consisting of four items, these are items 1 and 2 versus items 3 and 4, items 2 and 3 versus items 1 and 4, and items 1 and 3 versus items 2 and 4. Alpha has a big advantage over split-half reliability. It is not dependent on arbitrary selections of items since it incorporates all possible selections of items.
In practice, the calculation is based on the repeated-measures analysis of variance. The data in Table A.2 could be entered into a repeated-measures one-way analysis of variance. The ANOVA summary table is to be found in Table A.4. We then calculate coefficient alpha from the following formula:
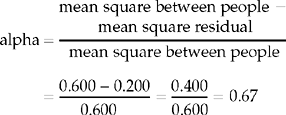
Of course, SPSS and similar packages simply give the alpha value.
...
Get a 30 day FREE TRIAL
-
 Watch videos from a variety of sources bringing classroom topics to life
 -
Read modern, diverse business cases
-
Explore hundreds of books and reference titles

Read next

More like this
Sage Recommends
We found other relevant content for you on other Sage platforms.
Have you created a personal profile? Login or create a profile so that you can save clips, playlists and searches